To those outside the energy sector, the process which companies find hydrocarbons, bring them to the surface, and deliver them to consumers may generate as much curiosity as pouring a glass of water from a kitchen sink. While the world is busy consuming roughly 4 million barrels of oil every hour1 – an amount equivalent to the daily production of one "super major" exploration and production (E&P) company and carrying capacity of two oil tankers2 – most consumers will be unaware of the complex systems, processes and tools necessary to fuel our economy, from the jet fuel that transports approximately 2.6 million US passengers a day, to the refined petrochemical products that are ubiquitous in almost every electronic gadget indispensable in of our modern world. The human, financial, and environmental risks associated with these activities were not even widely understood by those outside the oil and gas (O&G) industry until the Deepwater Horizon oil spill in the Gulf of Mexico a decade ago.
Against the backdrop of increasingly complex technological challenges to meet global demand for hydrocarbons, E&P companies must navigate a maelstrom of price fluctuations that are unparalleled in most developed industries. To illustrate this volatility, one merely needs to look at the price chart for West Texas Intermediate (WTI) over the past five years (see Figure 1).
From a high of $100 per barrel to a low of just $26, price volatility has made short and even long-term capital budgeting decisions challenging for participants in the O&G sector.
In addition to such volatility in crude oil prices, the overall O&G industry is facing several important trends: an inventory buildup, diminishing marginal returns of supply, increasing demand, competition and resource nationalisation, regulatory/legislative uncertainty, investments in technology, mergers and acquisitions, environmental and safety concerns, and geopolitical tensions. Some of these trends are highlighted below and explored in more detail in the following sections to understand this industry.
Figure 1: Historical WTI crude oil prices3

Recent trends across the O&G industry
The O&G industry has implemented technological improvements, drilling techniques and various other process improvements that have increased efficiency. Specifically, increasing emphasis on hydraulic fracturing and horizontal drilling techniques have made both hydraulic processes more efficient and prolific. Particularly in the US, the shift towards these techniques has drastically increased production levels, which has in turn pressured domestic prices for both oil and natural gas.4 Companies can (and do) differentiate themselves through capital investments driven by technology, and their ability to increase productivity from both currently producing fields as well as areas considered challenging and inaccessible.5 A key advantage of US shale investment is the short cycle of the capital investment and capital flexibility compared to conventional O&G investments.
Shale and hydraulic fracking
Shale hydraulic fracturing is one example of technological advancement in the industry which has unleashed significant potential to access previously unreachable reserves.6 In the US, this sector has witnessed strong production, despite falling investment and employment in the last couple of years. Furthermore, unconventional sources of hydrocarbons (tight gas, coal bed methane, and gas in shale formations, which could not be exploited previously) are now a commercial reality as a result of improvements in drilling and completion techniques (hydraulic fracturing, horizontal/directional drilling, and real-time visualisation of the drill path). These new sources have completely reversed the paradigm of capital investments in the US in the natural gas market: a market once structured around natural gas imports through liquefied natural gas (LNG) regasification facilities is now being transformed for exportation to Asian markets with LNG liquefaction plants.7
Tax issues in the E&P industry
For all the complications associated with the business of this industry, tax issues in the energy sector are even more complex. To grasp these, one must start from the very beginning, the E&P stage, and discern how income is retained by E&P participants in the industry.
First of all, it is important to note that the commercial venture of exploring and producing hydrocarbons is typically carried out by multiple unrelated parties, each with a financial interest in the property. The obligations of each unrelated party are governed by a number of contractual relationships, such as a joint operating agreement (JOA), a production sharing contract (PSC), concessions, licenses, lease participation agreements, and services agreements.8 Contracts between the resource owner, which may be private or a state/national oil company (NOC), and the non-government controlled independent or integrated O&G companies (IOCs), specify a wide variety of fees that the IOC must pay to the state.
The terms of these fiscal payment mechanisms can differ significantly by country, field and time, and include very complicated formulas for payouts. In approximately 60% of oil/gas arrangements, the rights to the output are either owned completely or shared with the NOC.9 These formulaic arrangements and varied profit-sharing regimes across multiple jurisdictions create nuanced challenges from a transfer pricing (TP) perspective.
Adding to this complexity, IOCs are also subject to a variety of taxes and levies including: license rentals based on area covered, royalties computed based on production volumes, corporate income taxes (CIT), and taxes on repatriation of profits (and are therefore 'dual capacity' taxpayers). Over the years, there has been an increase in the number of allegations made by several government organisations and global institutions such as the World Bank and the UN that IOCs use TP as a mechanism to shift profits out of resource-rich developing countries.
The following section provides a detailed discussion of the oil and gas supply chain, as an understanding of its complexity is necessary to understand the tax and transfer pricing consequences.
O&G supply chain: An overview
The accumulation of commercial quantities of O&G in the earth's surface is rare.10 Hydrocarbons form deep beneath the earth's surface when organic materials deposited in ancient sediments transform over millions of years under intense heat and pressure into liquid (crude oil) and gaseous (natural gas) hydrocarbons.11 The hydrocarbons then slowly migrate upward through faults and fractures because they are lighter in density than other fluids in the rock pores. If there is a path that leads to the surface, the hydrocarbons will emerge above ground in a seep or tar pit. If an impermeable layer of rock blocks the migration, a trap is formed, and the hydrocarbons accumulate in porous rock beneath the trap. Traps are often formed by salt domes, shale, chalk and other formations. The business of drilling for O&G consists of finding and drilling into these reservoirs of porous hydrocarbon-filled rock.
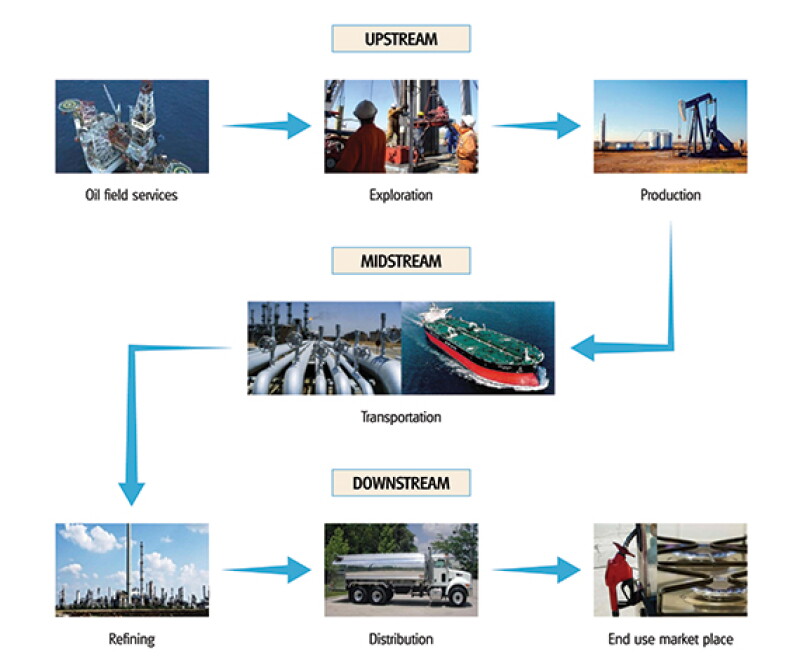
Upstream sector
Finding economically viable sources of hydrocarbons and bringing them to the surface is one of the fundamental activities performed by the companies that operate in the upstream sector of the O&G industry.
Exploration and production
Companies operating in upstream exploration and production focus on the acquisition, exploration and development of properties for the production of crude oil and natural gas from underground reservoirs. This process generally takes several years to complete. A geologist starts the process of finding hydrocarbons by looking for large structural traps, source and reservoir rocks in a geological basin.12 Seismological techniques are used to investigate subsurface conditions and create subsurface maps and surveys of the reservoir.
Some of the greatest improvements in petroleum exploration during the past two decades have involved new seismic acquisition techniques and computer processing of digital seismic data. Since seismic surveys contain huge amounts of data, various advancements are purely the result of increases in computing power. However, considerable progress has also resulted from the development of advanced algorithms that improve seismic imaging, especially in subsalt formations, where traditional seismic methods are ineffective. For instance, the Brazilian discovery of Santos basin, 150 miles off the coast of Rio de Janeiro after 2010, could contain 9 billion barrels of oil buried under 4.5 miles of water, sand, rock and salt deposits.13
While most people think of underground O&G deposits as deep pools of hydrocarbons, O&G reservoirs are typically wider than they are deep. It is therefore difficult to access the whole reservoir by drilling vertically. Starting in the 1990s, the industry began to develop technologies and processes to keep the wellbore in the 'pay zone' of the reservoir. Chief among these were rotary: steerable drilling assemblies that allowed for horizontal or directional drilling.
Directional drilling allows reservoirs to be tapped a long distance from the well site. It includes all forms of drilling where the well's end point is distant from the well site (rather than directly beneath it). Techniques have been enhanced by the placement of logging and measurement devices just above the drill bit on measurement-while-drilling and logging-while-drilling tools and systems. These allow the operator to visualise the drill path through the earth in real time, to make corrections to stay in the pay zone, and avoid obstacles.
Conversely, horizontal drilling may be three or four times costlier, but the production factors can be as much as 15-20 times better than conventional vertical wells.14
After the well is drilled and tested, there are two options for the E&P company: (1) the well is either plugged and abandoned as a dry hole, or (2) if commercial amounts of oil and/or gas are found in a test well, the process moves to the completion stage by setting pipe. Completing the well is typically more expensive than drilling a well.15 During this stage, production casing is screwed together, lowered into the well, and cemented to the outside of the wellbore. After the cement job, a wellhead is installed. This is a combination of steel flanges, spools, valves, chokes and manifolds, assembled into what is known as a Christmas tree, which is designed to provide surface control of the subsurface fluids. Subsea production systems (or wet trees) are complicated hydraulic and electrical structures installed on the sea floor and connected to floating production, storage, and off-loading vessels (FPSOs), subsea pipelines, or other platforms at the surface.16
One or more flow paths are then constructed by shooting holes in the casing and cement and into the reservoir along production zones using a perforating gun. This enables hydrocarbons to travel between the reservoir and the earth's surface. Production tubing is run through the casing and pumps are installed (most oil wells require a pump to lift the liquids to the surface). Even after the well is successfully completed and starts producing, it may not be profitable. Some of the most common reasons include:
Mechanical failures;
The wellbore missed the target zone (or was improperly placed within the zone);
The permeability of the reservoir was low;
The well failed to intersect fractures;
Drilling damaged the formation;
Drilling mud or chemicals leaked into the formation;
Unexpected variations in rock formations (causing water coning or sand to invade the wellbore);
The presence of flow barriers such as shale streaks inhibiting production; or
Feasibility studies were poor.17
Ultra-deep water discoveries of what appear to be large deposits of O&G have been recently found off the coasts of Angola, Brazil, Sierra Leon, Nigeria, and the Gulf of Mexico. Accessing these reservoirs will be extremely difficult, as the spot where the drill hits the seafloor is some 5,000 feet below the rig floor, and the target reservoir may be another three miles below the seafloor. Indeed, the cost of offshore drilling activities escalates almost exponentially with water depth. Given these costs and concerns, E&P and oilfield service companies have invested heavily in the development of ultra-deep water drill ships, drilling techniques, tools, and processes. However, given the significant decline in commodity prices, the O&G industry finds many of these assets cold-stacked, with capacity far exceeding demand.18
Table 1: Oilfield market segments20 |
Artificial lift Casing and tubing services Cementing Coiled tubing services Completion equipment and services Contract compression services Directional drilling services Downhole drilling tools Drill bits Drilling and completion fluids Floating production services Geophysical equipment and services Hydraulic fracturing Inspection and coating Land contract drilling Logging while drilling Offshore construction services Offshore contract drilling Oil country tubular services Petroleum aviation Production testing Rental and fishing services Rig equipment Solids control and waste management Specialty chemicals Subsea equipment Supply vessels Surface data logging Surface equipment Unit manufacturing Well servicing Wireline logging |
Equipment and oilfield services
What makes the O&G industry unique is not just the difficulty and risks faced by its participants, but also the sheer number of companies coming together at the well site to undertake this enterprise. Most of the drilling and completion activities are not performed by the E&P companies themselves, but by companies that operate in the equipment and oilfield services sector of the O&G industry. Between 85-95% of the money that E&P companies spend to develop O&G opportunities goes to service companies and suppliers.19
Consider the list of oilfield market segments in Table 1. Hundreds of independent companies operate in each of these segments around the world. Along with every piece of equipment and tool that is used in each segment comes a plethora of services. In terms of global revenue, the largest market segments are: offshore contract drilling, offshore construction services, pressure pumping services, land contract drilling services, tubular goods (such as drilling pipe), geophysical equipment and services (for example, seismic services), rig equipment, subsea equipment, wireline logging, and directional drilling services.
A typical E&P endeavor may involve different companies performing each of the activities listed above. It is a fragmented industry whereby many critical processes and activities are outsourced. Furthermore, these oilfield services companies also work together with IOCs and NOCs to develop the intellectual property (IP) and innovations necessary to respond to evolving demands, and are often relied on to fill engineering gaps faced by E&P companies. Recently, the industry has been focusing on technologies and processes that better integrate the activities of these disparate groups of service providers, and to develop knowledge sharing platforms so that information learned on one well can be leveraged.21
Midstream sector
The gathering, processing, storage, and transmission of natural gas and crude oil are the main operations of the midstream sector. Crude oil and other products are transported internationally in barges/tankers on water, and on land by trucks and pipelines. Natural gas typically moves through pipelines from the producer to the gatherer or transmission company, and then on to the distributor. These products are typically stored in bulk terminals, refinery tanks, pipeline tanks, underground salt domes, barges, tankers and inland ship bunkers.
Downstream sector
The downstream sector consists primarily of refining and marketing activities for crude oil, refined products and natural gas. This includes the refining of crude oil into various products like gasoline, jet fuel and diesel. Once the oil products are refined, they are sold to wholesale distributors, who sell to retailers and industrial users. Gasoline may also be sold directly by refiners to retail gasoline stations bearing the company's brand name and emblem, or independent dealers who own their stations and sell branded gasoline and other products from one or more oil companies. The distributors of natural gas and gas utilities receive their supply from transmission pipelines, and deliver it to the public through their own distribution facilities. Their customers include residential, industrial, commercial, and electric utility end-users. The different segments of the O&G industry are depicted in Figure 2.
Figure 2: O&G supply chain22
Digital revolution and the O&G supply chain
While the O&G industry is continually developing new technologies related to the extraction and processing of hydrocarbons, until recently, the digitalisation of the supply chain was not a top consideration. However, given lower oil prices, cost reduction has become a key strategy throughout the supply chain.23 As a consequence, investment in digital technologies like the internet of things (IoT) is critical to address supply chain inefficiencies, interconnect diverse data, reveal new data and create data-driven assets.24
These digital technologies may have implications across upstream, midstream and downstream segments of the O&G supply chain. In the upstream segment, current obstacles to a digital supply chain include data complexity and bottlenecks between the development, exploration, and production business segments of an E&P company. Using IoT applications such as smart sensors, well automation, equipment monitoring, and integration of physics and non-physics data through cloud computing can potentially transform current obstacles into efficiencies yielding industry innovations and potentially new understandings for future exploration opportunities.
Although economic benefits stemming from the digitalisation of upstream companies are related to the data analytics of collected date, for midstream and downstream companies, the implementation of IoT applications will also depend on applications that can create and collect new information, and produce digital assets. For example, operational software at midstream companies has limited capabilities for issues like breaches, bitumen spillage or temperature fluctuations. However, with IoT applications like vapor-sensing tubes, fiber-optic distributed temperature sensing systems, or fiber-optic distributed acoustic sensing systems, operational issues are no longer pre-defined, but can be monitored, proactively managed and analysed throughout the pipeline system.
Similarly, in the downstream segments, IoT can be applied to supply chain challenges surrounding enhancement of maintenance schedules, as well as producing connected marketing to assist fuel retailers competing in a digital ecosystem. For instance, IoT applications can include smart sensors, advanced wireless mesh networks, open communication protocols, integrated device and asset-management analytics. These applications in aggregation can assist in moving towards more predictive analytic maintenance strategies for O&G companies compared with the historical time-based approach.
However, with the rapid implementation of IoT applications to operational environments, there is an increased cybersecurity risk for O&G companies across the supply chain.25 These supply chain risks include potential data breaches related to geographical surveys, seismic imaging, field development planning, well completion, exploratory and appraisal drilling, well invention, production and development drilling.26 With the increased vulnerability, O&G companies are now redesigning their cybersecurity practices and control systems to migrate the risks associated with the implementation of IoT applications to upstream, midstream and downstream aspects of the O&G supply chain.
Transfer pricing regulations and guidelines
The US Treasury's section 482 regulations (Treas. Reg. §1.482) generally require that transactions between related parties occur at prices consistent with those between unrelated parties. This is based on the arm's-length principle, which is also adopted in Article 9 of the OECD's Tax Convention. Specifically, the regulation states that:
"A controlled transaction meets the arm's-length standard if the results of the transaction are consistent with the results that would have been realised if uncontrolled taxpayers had engaged in the same transaction under the same circumstances (arm's length result)."
The generally agreed upon practices of the OECD member states for determining TP are addressed in the OECD's Transfer Pricing Guidelines for Multinational Enterprises and Tax Administrations. The OECD guidelines and Treas. Reg. §1.482 set out methods for establishing arm's-length TP for tangible goods, services, technical assistance, trademarks or other assets that are transferred or licensed between related or controlled parties. These guidelines are widely accepted globally, with most countries formulating their TP rules around the guidelines, while others enact specific stringent regulations that are not far off from the purview of the guidelines.
In the US, Treas. Reg. §1.482 describes a set of methods that practitioners may use to determine whether the prices charged in controlled transactions are consistent with the arm's-length standard. Practitioners may also apply methods that are not specified in the regulations (if they are likely to yield a more accurate result than the specified methods). In practice, there is little difference between the TP methods described in the OECD guidelines and those in Treas. Reg. §1.482, other than the fact that the latter has specified methods for cost sharing arrangements that address the joint development of intangibles between two or more related parties.27
In addition to specific tax regulations addressing the energy sector, many petroleum-exporting countries are adopting TP documentation requirements. These countries include: Brazil, Canada, Kazakhstan, Mexico, Nigeria, Norway, Russia and Venezuela, among others. Interestingly, Russia's recent regulatory changes (which are committed to improving regional investment appeal) have been driven by a desire to avoid tax revenues losses and capital flight allegedly generated by activity in the O&G industry.28 In general, there has been a consistent rise in the number of countries with TP requirements, especially in emerging markets such as Brazil, China, India and Russia. The number of countries with an inclusive framework on BEPS stood at 127 as of January 2019, compared with the 12 countries with TP rules in 1994.29
Common TP issues in O&G
For TP practitioners, the energy sector can be exciting, as multinational participants exchange high volumes of tangible products (oil, gas, and chemicals), technical engineering services, loans, and technology on an intercompany basis. TP issues impact each of the streams in the O&G supply chain, especially for the vertically integrated "super major" E&P companies. Currently, over 40% of the US's cross-border transactions in the O&G sector are actually intercompany transactions between related parties.
Of the $143 billion in O&G products and equipment imported into the US during 2016, about $70 billion (or 49%) were transactions between related parties. In 2007, only 39% of total O&G imports were related-party transactions,30 whereas in 2016, the amount of US O&G exports was about $91 billion (33% of which were related-party transactions). This compares to 38% of the total exports in 2007. These figures suggest the growing importance of intercompany transactions in the O&G industry.31 The industry as a whole makes up 7% of total US imports and exports (see Table 2).
The largest intercompany transaction in this industry involves the purchase and sale of crude oil, natural gas, and various refined products from upstream producers to the midstream and downstream sectors. As can be seen in the table above, multinational energy companies exchanged more than $100 billion worth of hydrocarbons (on an intercompany basis) in the US during 2016.
Table 2: Value of US trades in 2016 (US$ millions)31 |
||||
NAICS code |
Import total trade |
Import related party trade |
Import related party trade |
Export related party trade |
US total goods |
2,173,617 |
1,071,342 |
1,071,342 |
378,297 |
211 O&G |
87,618 |
41,148 |
41,148 |
7,522 |
324110 Petroleum refinery products |
54,725 |
28,894 |
28,894 |
21,801 |
333132 O&G field machinery and equipment |
493 |
284 |
284 |
1,092 |
Total O&G (NAICS 211, 324110 & 333132) |
142,836 |
70,326 |
70,326 |
30,415 |
Typically, these transactions are based on market price indices that are widely used in the industry, such as Platts, the Oil Price Information Service (OPIS), and the New York Mercantile Exchange (NYMEX). Transactions tied to these benchmarks, whether between related or third parties, are often referred to as being priced 'at index' and normally include a 'differential' term that adjusts for crude quality (e.g. heavy/light), location, and other differences relative to the referenced index.
Crude O&G is transported using the midstream operations of a third party (or an affiliate of an E&P or downstream company). The crude oil sold to a related-party refiner serves as the feedstock used to produce refined products. These products are sold to petrochemical manufacturers or retail marketers, which could be either a third party or an affiliate of the refiner. Apart from the sale of crude oil, natural gas, and refined products, other tangible transactions include the sale or lease of drilling and production tools and equipment, rigs, offshore construction, and production vessels. Consumables such as sand, mud, water, chemicals and cement must also be used to drill and complete a well. As mentioned previously, a great number of oilfield service companies specialise in the manufacture and delivery of these various products to IOCs and NOCs.
Services are typically embedded in every aspect of the O&G industry, and are arguably the second largest source of related-party transactions after tangible commodity transactions. Intercompany service transactions in this industry are dominated by the provision of engineering and technical services to the upstream sector. These services involve exploration for hydrocarbons using seismic and geological/geochemical techniques and drilling, as well as testing, evaluation, and the completion, production and stimulation of the well.
Drilling and production problems require well interventions and workovers, solving mechanical and reservoir issues at the well. Each of these activities has a heavy engineering component and involves specialised tools, equipment, processes and software. Technical services are performed by IOCs, NOCs and oil field services companies, both on a third-party and intercompany basis. The obligations of each unrelated party are governed by a number of contractual relationships, such as a JOA and PSC.
A JOA generally governs the relationship between the working interest partners in a joint venture. The operator, typically the E&P company with the largest working interest in a property, manages the project, providing technical resources, decision making, and management services to the JOA. The IOC's host country activities generally involve the use of a controlled foreign corporation (CFC) that is part of a PSC (with either an NOC in the respective country, local governments, or other international IOCs, that are party to a JOA). Depending on the jurisdiction, the IOC may:
a) Own a working interest and operate the project; or
b) May have working interest with another investor being the operator.
In some instances, petroleum exporting countries may restrict the working interest percentages of foreign E&P companies, thus reserving rights to operate the project to local entities or NOCs. Irrespective of the IOC operating the project, it may be helpful to think of its CFC as typically having no employees (other than its board of directors and officers).
Accordingly, the CFC usually depends on the parent and affiliates for services associated with the property. If the CFC is the operator of that property, the JOA requires it to provide services for that property. Those services relate to exploration, development and production activities, as well as day-to-day management, all of which are provided to the JOA by the parent/affiliates on behalf of the CFC.
Managing the costs associated with those activities is of the utmost importance to E&P companies. Because these expenses represent the company's cash operating costs, they will determine the O&G price that must be received to earn a positive operating cash flow. From a services perspective, an important takeaway regarding the activity under a JOA is whether the IOC/NOC is the operator, or holds a non-operating interest in the property (along with a third-party operator).
A critical issue for TP purposes is to note that the IOC/NOC receives services from third parties and provides services to third parties in the context of its interest in JOAs, and that these services are typically provided at cost. The only difference between the IOC's intercompany and uncontrolled services transactions relates to the fact that the corporate parent does not have a direct economic interest in the JOA.
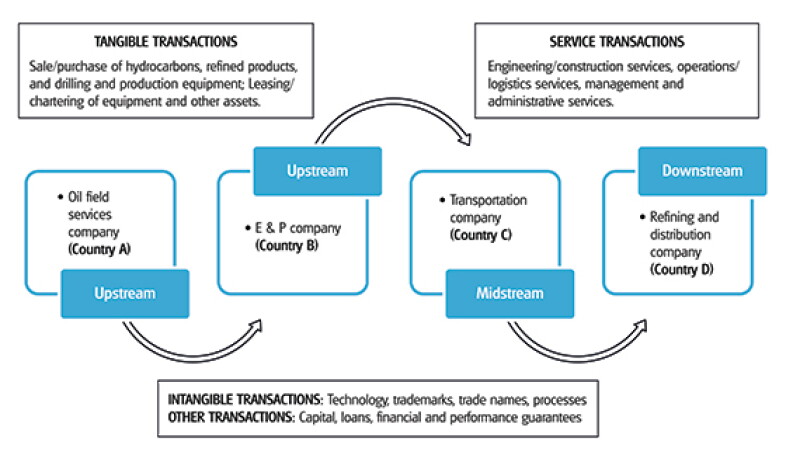
Downstream refining and manufacturing operations are also dependent on technical services from related and third parties. Other services transactions include the provision of crude oil trading services by a company to its affiliate, and the provision of management services by the parent entity to its subsidiaries around the globe. Some of the intercompany transactions observed in the O&G industry and their flow are shown in Figure 3.
In addition to services and tangible product transactions, the performance of a function by a foreign affiliate of an IOC or oilfield services company may be dependent on its access to certain intangibles necessary for the exploration, drilling, production, transportation and marketing of hydrocarbons and refined products.
These intangibles cover any IP owned by industry participants including patents, formulae, processes, designs, know-how, trademarks, brand names, licenses, contracts, methods, programs, systems, surveys, and technical data, which are licensed or sold to related or third parties. Intangible value may also be embedded in the tools and equipment or certain technical services.32 Other common transactions in the industry are financial transactions such as hedging, intercompany loans and guarantees.33
Figure 3: Illustrative types of intercompany transactions and trade flows in the O&G industry
Specific TP issues in O&G
With so many intercompany transactions taking place in the O&G industry, tax authorities and taxpayers around the globe may not agree about what is an arm's-length price for related-party transactions. The following sections discuss some of the TP issues that are often encountered by industry participants.
Services
Intercompany services are ubiquitous in the O&G industry. Services range from the provision of engineering and technical services, to management, administrative and other operations-related services provided by the corporate headquarters of industry participants. Service transactions are analysed by identifying the total costs, including employee stock options (ESO) and bonuses associated with the services provided, and determining which activities provide a benefit to service recipients. Typically, the costs associated with value-added activities are charged to service recipients with some profit element, while all other non-beneficial costs are determined to be either pass-through expenses, or stewardship (shareholder) related costs. These costs are then allocated to service recipients using an appropriate allocation method.
As a result of uncertainty regarding what is and isn't classified as beneficial activity, tax authorities are increasingly challenging deductions on expenses arising from intercompany services, requiring additional evidence (such as phone/travel receipts, time sheets, task deliverables) of actual services, or increasing the markup on outbound services transactions. In the authors' experience, the US Internal Revenue Service's (IRS) position on the pricing of engineering and technical services in the O&G industry appears to be evolving.
The types of arrangements under which intercompany services are provided within the O&G industry are not only unique but significant in terms of value. A large E&P company may provide more than $1 billion in intercompany services to affiliates annually. Industry participants often provide the same types of services at cost (or cost plus a small markup) to their related parties and third-party joint venture (JV) partners in the context of a JOA or PSC. The pricing to third parties has often been treated as comparable uncontrolled service prices (CUSPs) to determine related-party pricing.
However, in the authors' experience, the use of CUSP in analysing such transactions in the US has been challenged in some cases as the IRS has relied on the services regulations promulgated under Treas. Reg. §1.482-9 to compel O&G companies to include both stock option expenses and a profit element in their charges to affiliates, irrespective of whether foreign tax authorities, JV partners, or NOCs will accept such charges. At times, in the authors' experience, the mark-ups required on audit have been very large.
Given the recent global tax climate, local tax authorities have an incentive to maintain their current tax base and challenge the alleged benefits conferred to the local country affiliates. This can be highlighted with intercompany services charges that could have significant implications for the O&G sector. It is generally understood, for instance, that intercompany services and intangibles within the O&G sector can be weaved together. O&G companies employ processes, know-how, and technologies to find and produce hydrocarbons. Indeed, the use of new approaches in the discovery and development of oil fields is an industry hallmark and has been exemplified over time, as geopolitical events and the decline of easily reachable reservoirs are a catalyst for the industry exploring unconventional places. As such, based on the location of O&G supply chain functions, differing interpretations of the benefits and characterisation of services versus intangibles can exist between tax authorities.
Intangible property
The distinction between the provision of a service and the provision of a service bundled with an intangible is nebulous. It is important to consider whether there is anything proprietary associated with the service, whether the recipient is obligated to employ the results of such services, and if the services are accompanied by a manual (or any other device) that "has substantial value independent of the services of any individual".34 Industry participants and TP professionals are generally familiar with charges between related and unrelated parties for intangibles such as patents, trademarks, technology and know-how. Often, intangible property that is utilised in the related-party context (for example, patented manufacturing processes) can be licensed for a royalty payment that is benchmarked by internal or external comparable uncontrolled transactions (CUT) using publicly available license agreements.
However, while TP methods for IP transactions are well developed, applying such methods in the upstream O&G sector can create challenges. Intangibles used by E&P companies have often been developed in tandem with petroleum engineers and geoscientists at major universities, industry consortia, and oilfield services firms. These non-proprietary assets are shared freely (in certain cases) with JV partners and NOCs in the quest for hydrocarbons, typically on a royalty-free basis. Due to this ownership ambiguity, and the industry's openness to share know-how, best practices and technology, allocating a price to this expertise remains convoluted.
Further complicating intercompany IP valuations is the fact that there are so many different services, processes and intangible assets coming together at the well site to produce hydrocarbons. Few of these assets are significant on a standalone basis; so it is difficult to value their separate contributions. In other industries, a royalty payment for the value of the IP would be paid in an effort to appropriately compensate the IP owner. In the O&G sector, bifurcating the revenue stream from the sale of the resulting hydrocarbons between the amount resulting from the use of the IP (be it a tool, technique, process or patent) with more routine contributions is difficult due to the convergence of activities at the wellhead. Thus, some E&P and oilfield services companies have chosen to pursue expansive, multiparty cost sharing arrangements (CSAs), whereby all legal entities share in the cost of intangible development and are allowed the use of the resulting IP on a royalty-free basis.35
Changing global tax landscape
Over the past few years, national governments have dramatically increased the amount of legislation related to the protection of their current tax base, and enhanced the sophistication of their regulatory framework to tax corporate income. Driven by the dynamic global economic shift from primarily tangible to more digital products and services, these significant international tax concerns were center stage in national political debates. This economic shift further pressured governments to reassess their tax regulatory frameworks. Subsequently, the OECD published the BEPS regime, which seeks to establish new guidelines in the realm of international tax and TP to address the perceived gaps between local country tax regulations.
BEPS
While O&G companies' complex supply chains are continuing to expand globally (and are intertwined with intangibles), O&G multinationals were not the primary focus of the BEPS initiative, which was initially motivated to address the digital economy transformation spurred by technology multinationals. Still, the combination of global expansion and intangible intensity made BEPS a critical concern in the O&G industry. Specifically, the BEPS initiative focused on increasing global transparency through TP compliance in the form of the master file, local files, and country-by-country reporting (CbCR).
Moreover, BEPS aimed to address substance issues related to intangible management through a functional analysis of the development, enhancement, maintenance, protection, and exploitation activities, as well as the location of intangibles and decision-making capabilities. Furthermore, the BEPS final reports provided a framework for risk allocation focused on the substance and delineation of risk management activities compared to merely allocating risk contractually. BEPS significantly increased TP compliance, and required multinationals to reassess their supply chain and determine if value creation and decision-making capabilities were aligned.36
US tax reform
While O&G multinationals were navigating the new post-BEPS world, the US enacted tax reform, further adding to the complexity of the international tax and TP landscape. As a result of the Tax Cuts and Jobs Act (signed into law on December 22 2017), the US corporate tax rate fell to 21%, and the tax system moved towards a participation exemption style system for taxing foreign-source income of domestic multinationals.
A key provision for US O&G multinationals is the taxation of global intangible low-taxed income (or GILTI).37 Based on the US regulations, GILTI is a new category of income that aims to end the deferral of taxation on a significant portion of foreign earnings. Key aspects include:
1) The core of the GILTI calculation is to start with the foreign corporation's gross income (excluding certain items), and then to reduce that gross income by the foreign corporation's deductions (including taxes);
2) The remainder is then further reduced by a 10% return on the tax basis of depreciable tangible property (minus any relevant interest expense). The final amount is the GILTI amount included in income by each US shareholder of the foreign corporation; and
3) The tax liability resulting from the GILTI inclusion is reduced by a 50% deduction (before 2025), and a 37.5% deduction (minus a reduced foreign tax credit) thereafter.
The GILTI regulations provide a key exclusion for foreign oil and gas extraction income (FOGEI).38 However, FOGEI activities are typically inter-related with other foreign oil-related income (FORI) activities. These FORI activities typically relate to gathering, storing, or transporting gas to market. Historically, US treasury regulations related to FOGEI and FORI activities were developed in relation to foreign tax credits (FTC), and previously have not been applied to bifurcate income as required after the enactment of US tax reform.
Accordingly, an industry-specific aspect of the GILTI calculation is the profit-allocation determination between FOGEI and FORI. One of the prescribed approaches detailed in the IRS large and mid-size business field directive from 2004 (IRC §907 Evaluating Taxpayer Methods of Determining FOGEI and FORI) is the residual (rate of return) method. Under this method, FOGEI is determined by first calculating FORI-related income, and subtracting from the total income for the production and sale of the oil or gas product. To address the determination of FORI income, O&G multinationals may consider applying arm's-length TP methods outlined in Treas. Reg. §1.482 to derive reasonable FORI and FOGEI returns and income.
The recent regulatory changes highlight the need for a deep understanding of TP for O&G multinationals to remain nimble in the ever-changing global tax landscape.
Copyright © 2019 Deloitte Development LLC. All rights reserved.This article contains general information only and Deloitte is not, by means of this article, rendering accounting, business, financial, investment, legal, tax, or other professional advice or services. This article is not a substitute for such professional advice or services, nor should it be used as a basis for any decision or action that may affect your business. Before making any decision or taking any action that may affect your business, you should consult a qualified professional advisor. Deloitte shall not be responsible for any loss sustained by any person who relies on this article.
Nick Gaudioso |
|
|---|---|

|
Manager Deloitte Tax LLP Tel: +1 713 982 3857 Nick Gaudioso is a manager with Deloitte Tax LLP in the US transfer pricing group. He has five years of TP consulting experience. Based in Houston, Nick provides services to clients across multiple industries including energy, retail, media, software, chemicals, and healthcare. In addition, Nick provides TP services, US and global documentation projects, country-by-country reporting, headquarters cost allocations, intellectual property planning and valuation, cost sharing arrangements, intercompany financing, and advance pricing agreement (APA) negotiations. Nick is a certified public accountant and holds active licenses in Idaho and Texas. He holds an MS in accounting and a BBA in accounting and finance from Boise State University. Nick has published several articles on financial accounting and TP topics. |
Randy Price |
|
|---|---|

|
Managing director Deloitte Tax LLP Tel: +1 713 982 4893 Cell: +1 713 444 7247 Randy Price leads Deloitte Tax LLP's transfer pricing practice in the Houston office and is one of Deloitte's national transfer pricing leaders for the oil and gas (O&G) industry. Before joining Deloitte, Randy served as an international tax and TP leader for a Fortune 500 company. During his tenure in industry, Randy spent over a decade planning, implementing and ultimately defending multiple TP transactions from the IRS examination phase through to IRS appeals and Tax Court docketed status. In addition, he has participated directly in the defence and ultimate quashing of an IRS summons enforcement action in a US district court related to a TP information request. Randy's TP practice and experience span the entire spectrum of the O&G value chain and encompass all types of related-party transactions. He works with many of the world's largest oil field services companies in planning and coordinating their global TP documentation. Both within and outside the O&G sector, Randy has significant TP experience that involves the migration of intangibles, and attendant platform contribution and cost sharing issues. |
Nadim Rahman |
|
|---|---|

|
Senior manager Deloitte Tax LLP Tel: +1 408 704 2567 Nadim Rahman is an experienced senior manager in Deloitte Tax LLP's transfer pricing team focusing on oil and gas and technology companies. During his tenure with Deloitte Tax, he has managed various projects for large Fortune 500 clients, overseeing projects related to restructuring, global documentation, headquarters cost allocation, cost sharing, intangible valuation, intercompany financing, audit defence, competent authority assistance and advance pricing agreements (APAs). Nadim's recent energy publications include:
|
John Wells |
|
|---|---|

|
Principal Deloitte Tax LLP Tel: +1 214 215 4772 Dr. John Wells is the US and Americas leader of Deloitte Tax LLP's transfer pricing practice. John has extensive valuation and TP experience across a unique range of intangibles and industries, including processes, patents, technology, and knowhow associated with testing/calibration equipment, bolometers, application-specific integrated circuits, micro-electro-mechanical sensors, military grade thermal imaging cameras, wafer level packaging, photovoltaic solar panels, telecommunications equipment, gas and wind turbines, medical devices, drilling systems, drilling rig designs, ultra-deepwater exploration equipment, enhanced oil recovery techniques, poultry genetic lines; as well as chemical compounds and processes for carbon capture of methane emissions, fluid and hydro-cracking catalysts, flame retardants, biofuels, polymeric MDI, acetic acid, polyolefin, polyethylene, aromatics; and software algorithms for eCommerce, seismic imaging, gaming, GDS and revenue integrity, and scene-based non-uniformity correction. |
Endnotes
1 Hourly consumption of oil is based on conversion of annual consumption of oil from International Energy Agency, <http://omrpublic.iea.org/>.
2 Securities and Exchange Commission Form 10-K of Super Major oil companies.
3 US Energy Information Administration, January 2014-December 2018, <https://www.eia.gov/dnav/pet/hist/ RWTCD.htm>, accessed January 6 2019. This data was used by Deloitte Tax to create the graph presented.
4 IBISWorld Business Environment Profile: World Price of Crude Oil, March 2018.
5 Ibid.
6 IBISWorld Industry Report: Global O&G Exploration and Production, March 2018.
7 Samuel Fletcher, Randy Price and Vitaliy Voytovych, "Primer on liquefied natural gas transfer pricing," 2015, International Tax Review, Energy Issue 4th edition No. 102, <https://www2.deloitte.com/content/dam/Deloitte/us/Documents/Tax/us-tax-itr-energy-guide-4th-edition.pdf>, accessed December 21 2018.
8 A JOA in the O&G context is a legal document that irrevocably vests in some person or persons, acting in a representative capacity, the authority to extract and sell O&G for the joint account of two or more partners. Model JOAs are provided by the Association of International Petroleum Negotiators, <https://www.aipn.org/model-contracts/>. PSCs govern the contractual relationship between a national government or NOC and the E&P companies working the property.
9 Emil M. Sunley, Thomas Baunsgaard and Dominique Simard, 2002. "Revenue from the Oil and Gas Sector: Issues and Country Experience", IMF Conference June 5–6, 2002, <http://siteresources.worldbank.org/INTTPA/Resources/SunleyPaper.pdf>, accessed January 3 2019.
10 For this section, please refer to Nontechnical Guide to Petroleum Geology, Exploration, Drilling and Production, Norman J. Hyne, PennWell, 2012, and industry publications Upstream (http://www.upstreamonline.com/), Petroleum Economist (http://www.petroleum-economist.com/), Drilling Contractor (http://www.drillingcontractor.org/), the Energy Information Administration (http://www.eia.gov/), Wood Mackenzie (http://www.woodmac.com/research/), and the American Petroleum Institute (http://www.api.org/). An overview of activities in the E&P segment, especially offshore drilling, can be found in Deep Water Report.
11 The ideal conditions for O&G formation are between 180 and 450 degrees Fahrenheit and depths of 7,000-25,000ft, with more gas than oil being produced at higher temperatures and pressure. If temperatures or pressure rise too high, the organic material decomposes to carbon dioxide and water. O&G Production in Nontechnical Language, 2nd Edition, Martin Raymond and William Leffler, PennWell, 2017.
12 A geologist is a scientist who studies the earth by examining rocks and interpreting their history. A geophysicist is trained in physics and mathematics to study the subsurface using gravity, magnetic and seismic readings.
13 Wood Mackenzie, September 2018, South America's offshore boom accelerates in Guyana and Brazil, <https://www.woodmac.com/news/editorial/south-america-offshore-boom-accelerates-with-guyana-brazil-developments/>, accessed January 2 2019.
14 Eric Molvar, Drilling Smarter: Using directional drilling to reduce oil and gas impacts in the intermountain west, <https://www.voiceforthewild.org/blm/pubs/DirectionalDrilling1.pdf>.
15 Hyne.
16 Raymond and Leffler.
17 Molvar, Deep Water, Raymond and Leffler.
18 Critical issues and drilling & completions, Drilling Contractor, January/February 2017 and January/February 2018.
19 Raymond and Leffler.
20 Spears & Associates, Inc., Oilfield Market Report, <https://spearsresearch.com/reports/oilfield-market-site-license>, accessed December 27 2018.
21 Critical issues and drilling & completions, Drilling Contractor, January/February 2017 and January/February 2018.
22 Segun Oladunjoye, Randy Price, Nadim Rahman and John Wells, "Transfer Pricing in the oil and gas sector: A primer," 2012, International Tax Review, Energy Issue 3rd edition No. 71, <https://www2.deloitte.com/content/dam/Deloitte/us/Documents/Tax/us-tax-itr-energy-guide.pdf>, accessed December 21 2018.
23 John England, "2018 Outlook on Oil and Gas", Deloitte Center for Energy Solutions, December 2017, <https://www2.deloitte.com/content/dam/Deloitte/us/Documents/energy-resources/us-oil-and-gas-outlook-2018.pdf>, accessed December 27 2018.
24 Andrew Slaughter, Gregory Bean, Anshu Mittal, "Connected barrels: Transforming oil and gas strategies with the Internet of Things," Deloitte University Press, August 2015, <https://www2.deloitte.com/content/dam/Deloitte/es/Documents/energia/DeloitteEsEnergiaDUP-Internet-of-Things-for-OilGas.pdf>, accessed December 27 2018.
25 Paul Zonneveld and Andrew Slaughter, "An integrated approach to combat cyber risk: Securing industrial operations in oil and gas," November 2016, <https://www2.deloitte.com/global/en/pages/energy-and-resources/articles/integrated-approach-combat-cyber-risk-energy.html>, accessed December 27 2018.
26 Anshu Mittal, Andrew Slaughter and Paul Zonneveld, "Protecting the connected barrels: Cybersecurity for upstream oil and gas," https://www2.deloitte.com/tr/en/pages/energy-and-resources/articles/oil-and-gas-cybersecurity.html, accessed December 27 2018.
27 While the OECD Guidelines do not proscribe specific transfer pricing methods for cost sharing arrangements, Chapter VIII does provide guidance in reference to arm's length contributions for cost contribution arrangements
28 "Tax legislation | Tax legislation 2018: key development and outlook," Deloitte Russia Consulting, June 2018, <https://www2.deloitte.com/content/dam/Deloitte/ru/Documents/tax/tax-updates-2018-en.pdf>, accessed January 3 2019.
29 For the list of all the countries acting as members of the inclusive framework on BEPS, refer to OECD's Members of the Inclusive Framework on BEPS. <http://www.oecd.org/ctp/beps/inclusive-framework-on-beps-composition.pdf>.
30 The NAICS related-party data is sourced from The US Census Bureau.
Related-party trade includes import transactions between parties with various types of relationships, including "any person directly or indirectly, owning, controlling or holding power to vote, 6 percent of the outstanding voting stock or shares of any organization," and a related-party export transaction is one between a US exporter and a foreign consignee, when either party owns, directly or indirectly, 10 percent or more of the other party.
31 The O&G industry is defined here as a combination of NAICS code 211 – O&G Extraction, 324110 – Petroleum Refinery Products and 333132 – O&G Field Machinery and Equipment Manufacturing.
32 Treas. Reg. §1.482-4(b) and §1.482-9.
33 Randy Price, Nadim Rahman, and Bill Yohana, "Transfer pricing and intra-group financing," 2012, International Tax Review, Energy Issue 3rd edition No. 71, <https://www2.deloitte.com/content/dam/Deloitte/us/Documents/Tax/us-tax-itr-energy-guide.pdf>, accessed December 21 2018.
34 Treas. Reg. §1.482-4(b). See also the OECD Guidelines Chapter VI, which indicates that an intangible must be capable of being owned or controlled for use in commercial transactions and may be used in connection with a service without an actual transfer of the intangible occurring.
35 Under a CSA, two (or more) related companies agree to share future risks and costs associated with R&D of new technology to be used by each participant in their respective territories, in proportion to reasonable anticipated benefits in the future. However, if future R&D is expected to build on current technology developed by one of the companies, the other cost sharing participants must buy in Treas. Reg. §1.482-7(c) calls the payment for such preexisting technology platform contribution transaction (PCT). After buying in, the cost sharing participant will continue to participate in the development of subsequent technologies based on either the preexisting technologies or brand-new technologies. The intangible development costs (IDC) associated with these future technology developments is shared by participants in the CSA.
36 Nadim Rahman and Vitaliy Voytovych, "Relevant BEPS developments and implications for oil and gas industry," 2015, International Tax Review, Energy Issue 4th edition No. 102, <https://www2.deloitte.com/content/dam/Deloitte/us/Documents/Tax/us-tax-itr-energy-guide-4th-edition.pdf>, accessed December 21 2018.
37 IRC §1.951A.
38 Prop. Treas. Reg. §1.951A-2(c)(1)(v).