Recent OECD guidance on transfer pricing documentation (Action 13) requires multinational enterprises (MNEs) to identify where and how value is created in the business operations, including:
Consideration of the economically significant functions, assets and risks;
Which party performs the functions, contributes the assets and assumes the risks;
How the functions, assets and risks are inter-related;
How the economic circumstances may create opportunities to capture profits in excess of what the market would allow (e.g. unique intangibles or first mover advantages); and
Whether the value creation is sustainable.
We will refer to this as the value chain analysis, or VCA. Recent (non-consensus) guidance on the transactional profit split method (PS, or PS method) cautions that a VCA is merely a tool to assist in accurately delineating a transaction and is therefore part of a functional analysis. In particular, it may be helpful in determining the most appropriate method, which may or may not be the PS method. The existence of a global value chain does not cause the transactional PS to be the most appropriate method. Describing a value chain analysis as a delineation tool for a specific transaction, rather than as a justification to apply a profit split, is a significant change in direction from the (non-consensus) December 2014 discussion draft on the use of profit splits in the context of global value chains. While certain parts of a business may be considered routine (i.e. can be benchmarked based on a functional analysis), benchmarking vertically integrated businesses can be challenging and thus make a VCA difficult to perform.
To understand why this is the case, we must delve into the economics of vertical integrated supply chains, best summarised by Paul Joskow in his paper titled "Asset Specificity and the Structure of Vertical Relationships: Empirical Evidence" (see "Nature of the Firm" edited by Williamson and Winter; Oxford 1993) – "The conditions under which businesses decide to engage in market-based transactions on a non-exclusive "spot" basis are very different from the conditions under which businesses decide to engage in market based transactions on an exclusive "long-term contractual" basis which in turn are very different from the conditions under which businesses decide to internalize market transactions within the same organisation through vertical integration." This is a consequence of potential mismatch in the incentives of parties over time and is often referred to as the "hold-up problem". Joskow further writes: "The key considerations behind such differing structures rest on the importance of asset
specificity, uncertainty, product complexity and the constraints on repeat transactions. Examples of asset specificity include:
Site specificity – where the buyer and seller are in a long-term relationship, reflecting ex ante decisions to minimise inventory and transportation costs. Once sited, the assets in place are highly immobile;
Physical asset specificity – when one or both parties to the transaction make investments in equipment and machinery that involves design characteristics specific to the transaction and which have lower values in alternative uses;
Human asset specificity – investments in relationship-specific human capital that often arise through a learning-by-doing process; and
Dedicated assets – general investments by supplier that would not otherwise be made but for the prospect of selling a significant amount of product to a particular customer. If the contract was terminated prematurely it would leave the supplier with significant excess capacity."
An integrated supply chain characterised by a high degree of asset specificity, uncertainty or product complexity may be hard to benchmark and, therefore, certain parts of such a supply chain may be considered non-routine. A PS analysis may then be the most reliable method for analysing such supply chains or parts thereof. It should be noted that at arm's length each party to a transaction optimise their own value, however MNEs by definition optimise value of the group as a whole.
For a meaningful discussion of VCA, we must, at the outset, have a common (a) definition of value and (b) understand what contributes to the creation of such value. One can think of three potential definitions:
Price of goods or services sold to third parties;
Value added or price of goods or services sold to third parties less price of related inputs purchased from third parties; or
Some measure of profit, e.g. gross profit, operating profit, contribution margin.
Value is created by labour and capital. Price must, on average, cover costs of inputs purchased from third parties, wages and salaries of employees, and provide an adequate return to capital adjusted for risks. Capital carries residual risk and return to capital (profit) is the key focus of transfer pricing.
Therefore, to document and measure how value is created we must understand how risks are created. Risks of a business (as measured by unlevered beta) emanate from two main sources:
Nature of product or service offered: Other things being equal, the more discretionary the demand for the product or service, the higher the risk. For an integrated supply chain, this risk is common for all sub-units of the supply chain; and
Operating leverage (fixed costs as a percentage of total costs): Other things being equal, the higher the proportion of fixed costs in total costs, the higher is the risk in the business. Unlike the first source of risk, this risk is not common for all sub-units of an integrated supply chain because fixed costs vary between the stages of a supply chain.
Diagram 1
(This diagram is adopted from Aswath Damodaran – Estimating Beta "http://people.stern.nyu.edu/adamodar/pdfiles/eqnotes/discrate2.pdf)
Click on diagram to enlarge
Our framework for defining and measuring value creation rests on this determination of risks that is non-diversifiable and is therefore entitled to an adequate market based return.
We build on this notion of operating leverage by recognising that fixed costs in any business not only reflect accounting fixed costs (such as rent, utilities, etc.) but also fixed costs of assets (both on and off balance sheet) usage (i.e. depreciation and amortisation) as well as the opportunity cost of financing the (on and off balance sheet) assets. This is an essential first step to move from an accounting P&L to an economic P&L so that the financials reflect the economic fixed costs of running the business or the sub-unit within the MNE. In the rest of our discussion below, our reference to operating leverage should be interpreted using the definition of operating leverage that reflects the economic fixed costs in the numerator.
Consistent with operating leverage, we choose contribution margin (defined as revenue minus variable costs) as the measure of value for the VCA analysis of an integrated supply chain. Contribution margin must, on average, cover fixed operating costs and provide an adequate return to debt and equity capital. Aligning profits based on value creation is therefore analogous to allocating the consolidated contribution margin to the various entities that have contributed to the creation of such value which, in turn, is measured by their share of risks in the business defined by their respective operating leverages. We will call this analysis economic profit split (EPS).
In transactions between unrelated parties, the parties agree ex ante on their expected respective cost structures, investments and assets, and often agree on revenue sharing arrangements reflecting their relative risks. This is to counteract the asymmetric information problem that exists in any long term arrangement between unrelated parties.
In related party transactions, this asymmetric information problem is alleviated through centralised management and control. Thus ex post contribution margin (or revenue) can be split among the sub-units of an integrated supply chain based on the relative modified operating leverage of the sub units.
It should be noted that while almost all fixed costs can be tied to a location where they are first incurred, they can be made variable and shifted contractually (e.g. by providing a fixed ex post mark-up on all operating costs or by providing a fixed ex post operating margin), thereby shifting risks from the location where incurred to another location (e.g. a principal). However, contractual risk shifting arrangements without meeting the control requirements articulated at paragraphs 1.61, 1.65 and 1.94 of the OECD Transfer Pricing Guidelines for Multinational Enterprises and Tax Administrations may be ignored by tax authorities. More specifically, risks must be accompanied by the performance of risk control and management (OECD Par. 1.61;1.65) defined as (a) capability and performance of the decision to take risk; (b) capability and performance of responding to changes in risk; and (c) capability and performance of risk mitigation. Risk control and management focusses on responses to potential and actual events; not necessarily the control of whether an event occurs because many events are not within the control of the MNE (e.g. business cycle). Day-to-day risk mitigation may not be an important function if the controlling party (OECD Par. 1.65) (a) determines the objectives or the outsourced activity; (b) has the ability to hire/fire; (c) can and does access whether the objectives are being met; and (d) can terminate the contract.
To perform a meaningful EPS, economically meaningful P&Ls and balance sheets need to be constructed. Those economic financial statements are often constructed using accounting P&Ls and balance sheets as a starting point and then separating out variable costs from fixed costs (for example) rather than separating out cost of goods sold from operating expenses, as is the case in an accounting P&L. Similarly, an economically meaningful balance sheet will show intellectual property as an on-balance sheet asset rather than not showing it, as is the case in an accounting balance sheet (when the IP is internally developed).
More specifically, the steps required for an EPS analysis are as follows:
1. Prepare consolidated income statement (P&L) and balance sheet based on region/country of final sale for product or product lines;
2. Prepare un-consolidated P&L and balance sheet broken down amongst entities in the supply chain with respect to item #1 above;
3. Identify all costs that are not correlated to current revenue. This is our measure of fixed costs that create off-balance sheet assets, (e.g. certain portions of R&D, marketing and promotion, training, leadership and strategic management);
4. Estimate lead time, useful life and probability of failure (if necessary) for the above costs and quantify value of off-balance sheet assets;
5. Create analytical P&L by removing the above costs from the P&L and replacing with amortisation of off balance sheet assets;
6. Bifurcate COGS into variable and fixed. Accounting fixed costs would include PPE depreciation and certain factory overhead. Detailed cost accounting combined with qualitative research or regression techniques may be used to create this bifurcation;
7. Bifurcate SGA from analytical P&L (after removing current costs of creating off balance sheet assets described above and adding amortisation of off-balance sheet assets). Fixed costs would include amortisation of off-balance sheet assets and depreciation of tangible property. Detailed cost accounting combined with qualitative research or regression techniques may be used to create this bifurcation;
8. Compute consolidated contribution margin (revenue minus variable costs in COGS and SGA of analytical P&L);
9. Compute financing fixed cost (or opportunity cost of carrying assets) using on and off- balance sheet asset balances multiplied by risk-free rate;
10. Perform the control test (within the meaning of 1.61, 1.65 and 1.94) to determine control over the economically significant risks resulting from the commitment of significant fixed costs. Re-allocate the fixity of the costs to the legal entity satisfying the control test (if different from the legal entity bearing those costs in accounting statements);
11. Split contribution margin based on relative share of fixed costs (sum of operating fixed costs and financing fixed costs) of the parties in the supply chain; and
12. Recreate accounting P&L of entities in the supply chain based on split of contribution margin calculated above.
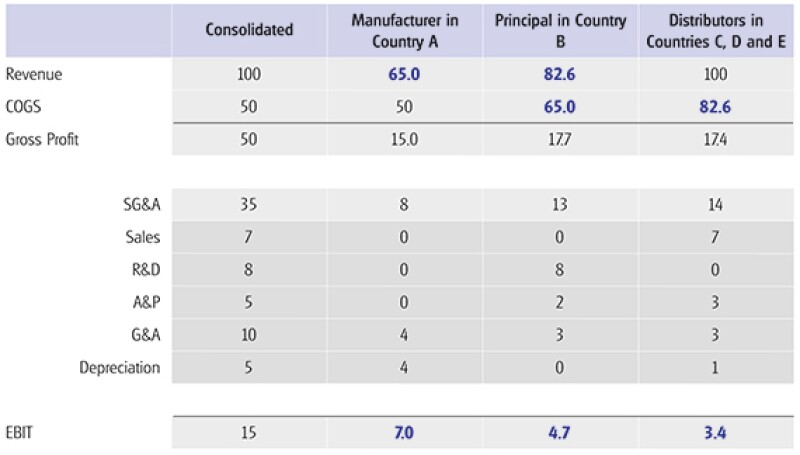
We have provided a detailed step-by-step example of how this method can be applied in the context of a hypothetical example in the Appendix to this paper. In this stylised example, a MNE with a manufacturer, an IP principal and distributors in its global supply chain generates 15 units of consolidated operating profit which gets split seven units,. 4.7 units and 3.4 units between the manufacturing entity, IP principal and the distributors respectively. Intuitively, the example captures the fact pattern that of the total consolidated costs of 85 being borne in the group, the manufacturer bears 68% of such costs and the distributor bears 16.5% of the expenses (excluding the COGS) as distribution related operating expenses.
The EPS method provides an alternate to a CPM/TNMM based approach to justifying profits to any sub-unit within an MNE and can therefore form a very useful basis to validate the results of such benchmarking analyses. It is also a powerful framework to test the outcomes from this method against actual results (based on the chosen transfer pricing policy of the MNE) of the sub-units that may give rise to meaningful questions to identify gaps/risks in justifying the actual results against the economics of the business as a whole.
In conclusion, we have outlined the key approach to a VCA and how one may apply economic principles to determine the ex-post split of the consolidated contribution margin in a global value chain taking into consideration the economic risks being borne by the various entities within a MNE. Our methodology allocates the ex post contribution margin (or revenue) among the sub- units of an integrated supply chain based on the relative modified operating leverage of the sub units. The results of our EPS provides a reasonable arm's-length approximation of the allocation of profits within an MNE that are aligned by the creation of value within the MNE's integrated supply chain.
Appendix: Application of the EPS
The following example and tables demonstrate the execution of the above steps in a simplified fact pattern. Consider five entities in the MNE's supply chain – a manufacturer (MFG), a principal (P) responsible for investing in R&D and certain advertising and promotion, and distributors (DSTs). The intercompany transactions are (1) sale of finished and semi-finished products from MFG to P and (2) sale of finished products from P to DSTs in various locations.
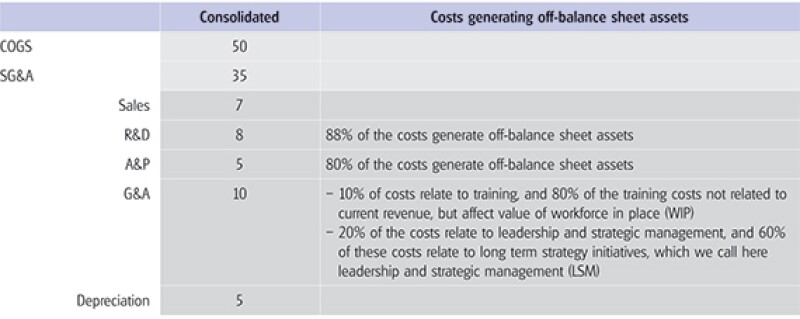
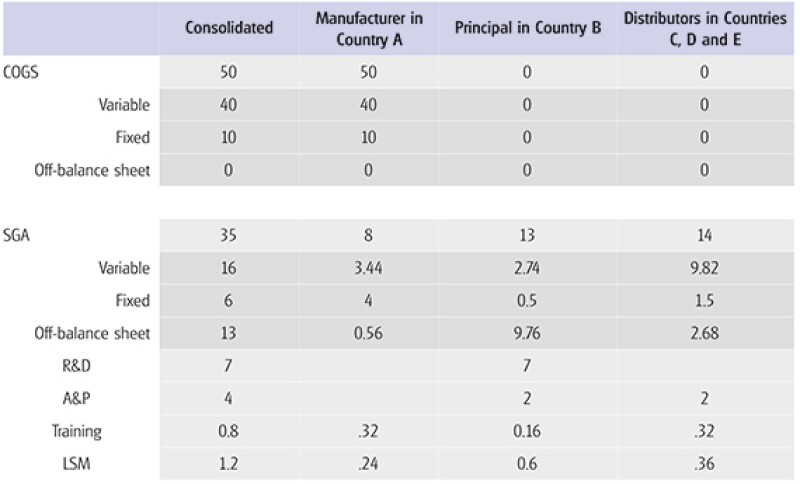
Tables 1 and 2 show the first two steps in the analysis outlined above: the consolidated P&L and balance sheet for the MNE, as well as for its different units respectively. For each entity, the line item affected by related party transactions is denoted using a question mark. Table 3 shows step three in the EPS analysis outlined above, which consists of estimating the costs related to the creation of off-balance sheet assets (OBSA). First, the cost categories that generate off-balance sheet assets need to be identified, as shown on Table 3. Second, the percentage of costs in that category, which are NOT related to current revenue, must be isolated in order to determine the costs generating OBSA that will drive revenue in the future.
Table 1: MNE segmented and consolidated P&L for 2015 ($ million)
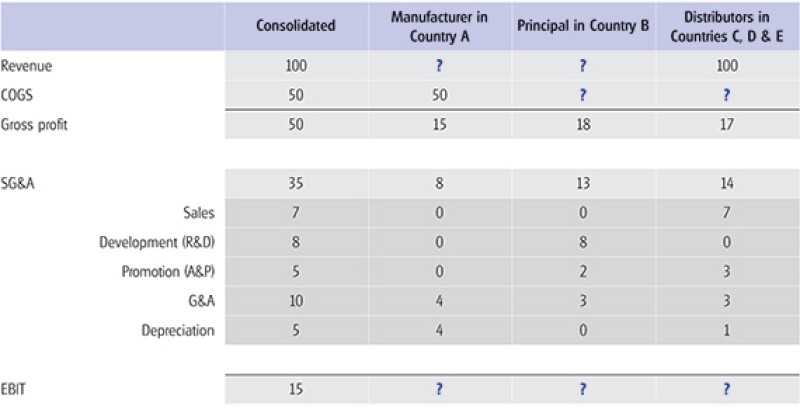
Table 2: MNE segmented and consolidated balance sheet for 2015 (USD mil)
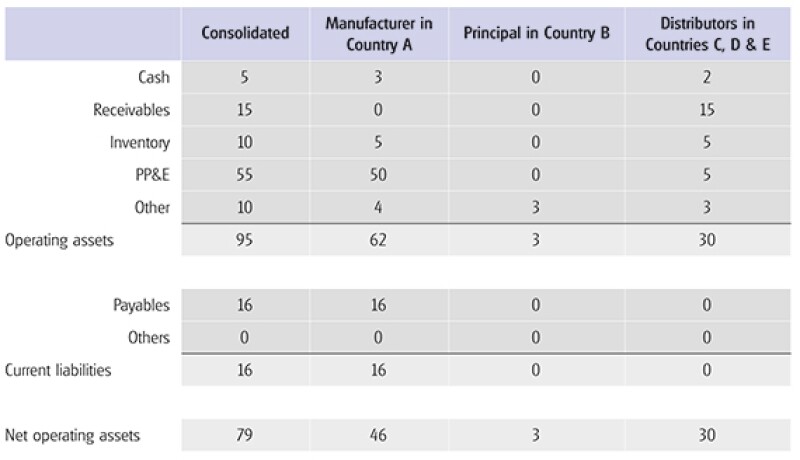
Table 3: Identification of costs generating OBSA
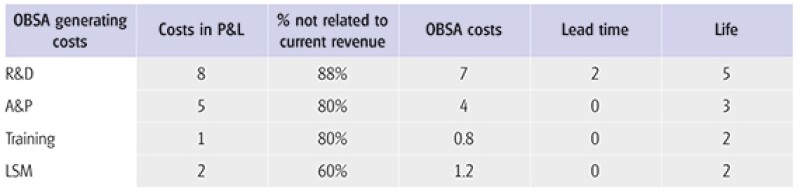
Additionally, this step also involves determining the lead time, life, amortisation schedule, and probability of success tied to the costs identified as generating OBSA. These analyses are performed to in order to determine the costs incurred in the past that are generating revenue in the current period. Information about life, lead time, and amortisation schedule should be gathered during functional interviews with personnel knowledgeable about the MNE’s business and its risks. Tables 4, 5 and 6 show a sample analysis to identify the costs that generate OBSA, the balance of the OBSA related to each cost category, and the OBSA amortisation for the period.
Table 4: Construction of OBSA
The life and lead time are used to generate an amortisation schedule to determine when the costs incurred generating OBSA will generate revenue. Table 5 shows a sample OBSA amortisation schedule based on the lead and life information from Table 4, and for the scenario where OBSA are not subject to a probability of success adjustment and the amortisation schedule is linear.
Table 5: Amortisation schedule of OBSA
The amortisation schedule and historical costs generating OBSA allows for the calculation of the stock of the OBSA (i.e. the total costs incurred in the past that will drive revenues in the future) and the depreciation of the OBSA, which determine the costs that are generating revenue in the current period.
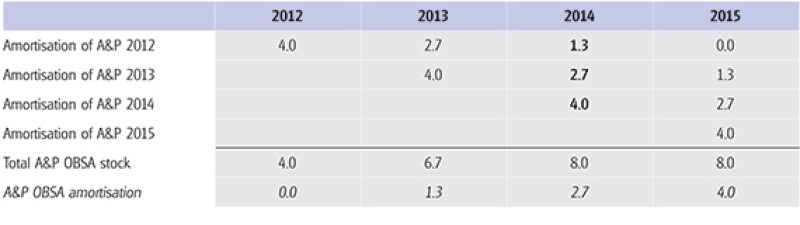
Table 6 present the build-up of the OBSA generated by A&P costs under the amortisation schedule from Table 5, and that the net present value of costs incurred in the prior years is the same as during the current period. The OBSA stock is the total costs incurred in the past that will generate revenue in the future, and the OBSA amortisation (i.e. the fixed costs contributing to the current period revenue) is the change in OBSA stock minus the OBSA generating costs in the current period. That is: OBSA amortisation = OBSA stock (t-1) – OBSA stock (t) + OBSA generating costs (t).
Table 6: Build-up of A&P off-balance sheet assets and amortisation example
Following the identification of the P&L costs generating OBSA and the OBSA amortisation determined by an analysis of the historical OBSA generating costs, and the life and lead time of these costs, the remaining costs in the P&L are identified as either period fixed costs (i.e. fixed costs that do not generate OBSA), and variable.
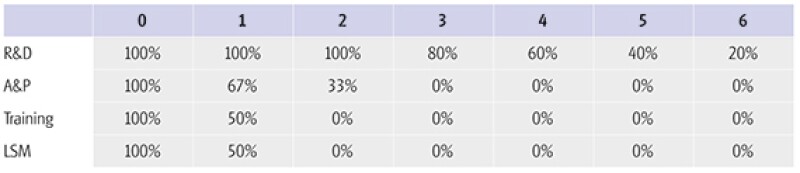
Table 7 shows the classification of the P&L into the three categories of costs: period fixed, variable, and generating OBSA under the following assumptions:
OBSA amortisation is at steady state (i.e. the amortisation is the same as the costs incurred);
50% of R&D and A&P spend that does not generate OBSA is assumed to be fixed (related to maintenance);
All maintenance A&P will be performed by the distributor;
The allocation of A&P is 50%-50% to the principal and the distributor;
The allocation of training related costs is 40%-20%-40% to M, P, and Ds respectively;
The allocation of LSM costs is 20%-50%-40% to M, P, and Ds respectively; and
Due to the lead and life assumptions on R&D costs, a portion (40%) of the OBSA generated by R&D spend is not related to current period.
Table 7: Classification of accounting P&L costs
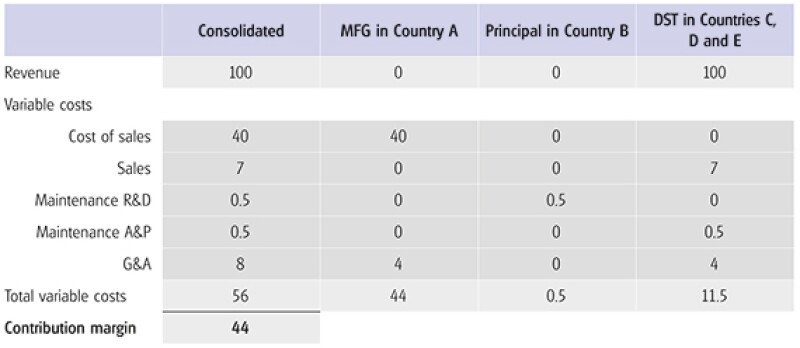
The following step (Step 8 in the EPS outlined above) is to calculate the contribution margin, by subtracting the variable costs form the revenues, as shown in Table 8.
Table 8: Contribution margin
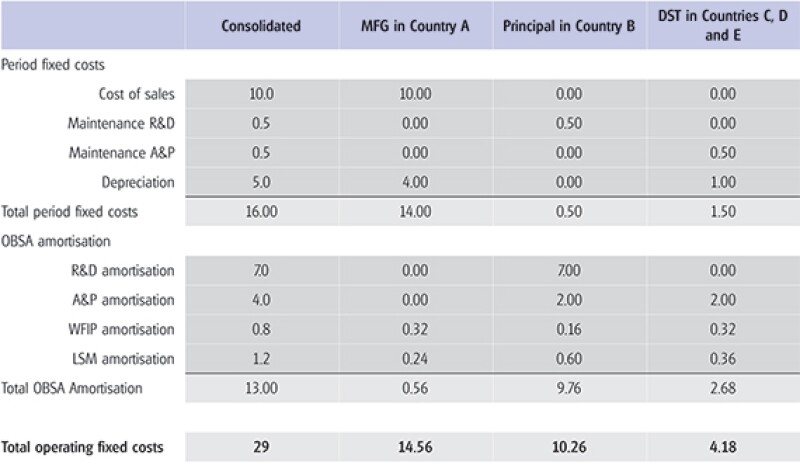
The contribution margin is split based on the fixed costs assumed by each entity in the MNE, which include (1) OBSA amortisation; (2) period fixed costs; and (3) carrying costs (opportunity cost) of assets for both on- and off-balance sheet assets. OBSA amortisation and period fixed costs are shown in Table 9.
Table 9: Operating Fixed Costs
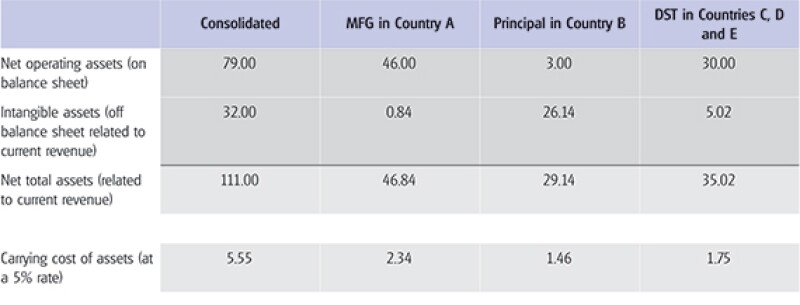
To calculate the carrying costs of assets, the balance of the OBSA assets needs to be added to the net operating assets from the balance sheet. The calculation of the OBSA balance is shown in Table 10, and the carrying cost of assets (assuming a 5% rate) in Table 11.
Table 10: OBSA balance
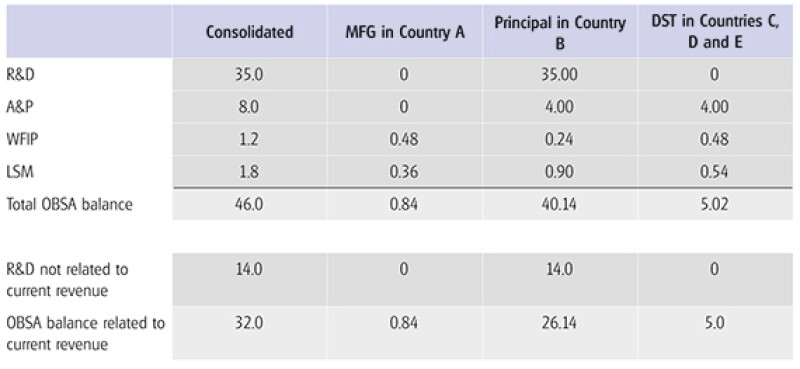
Table 11: Carrying Cost of Assets
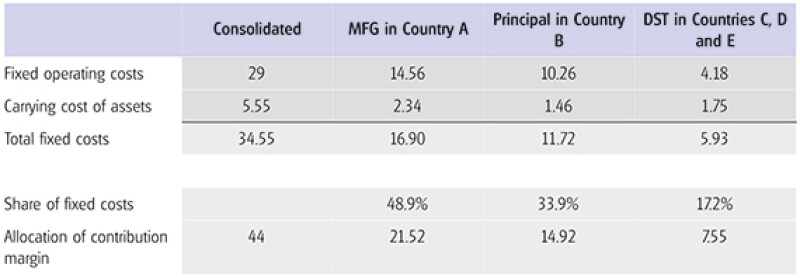
Finally, Table 12 shows the split of the contribution margin (calculated in Table 8), based on the fixed costs assumed by each MNE participant.
Table 12: Contribution Margin Split
Based on the allocation of the contribution margin, the operating profit for each MNE participant will be its share of the contribution margin minus the fixed costs (both OBSA generating costs and period fixed costs) incurred during the period that appear in the P&L.
Table 13 shows the transfer prices that would generate the profits to the participants aligned with the application of the EPS.
Table 13: Transfer prices and P&L aligned with EPS
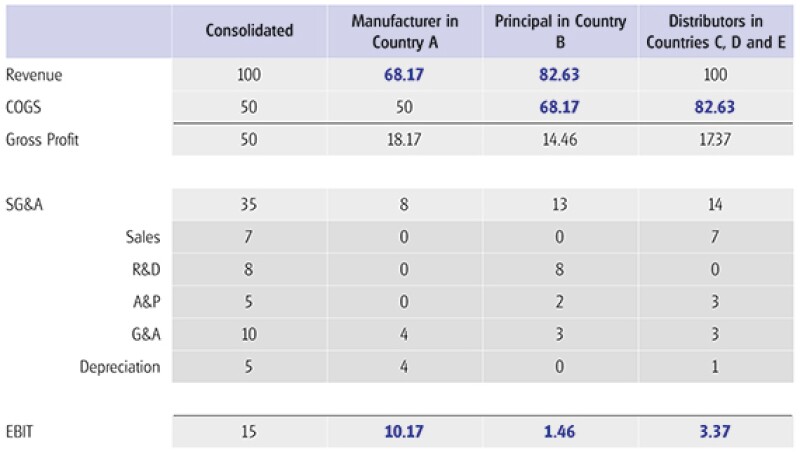
Moreover, the EPS outlined in this article, provides a framework to follow the guidance on the allocation of risk from OECD Par. 1.98; 1.99, in which risks and returns should be allocated to the MNE exercising the control over the risk (within the meaning of Par. 1.61, 1.65, and 1.94), and having the financial capacity to bear the risks. In the EPS, the reallocation of risk is carried out by reallocating the fixed costs associated with the risks. Consider for example the situation where the facts are the same as in the example outlined above, with the exception that the principal is a “dumb cash box”. Hence, the principal does not control any of the risks associated with the costs in its P&L, and the MFG is assumed to have substance and control of the principal. Therefore to reflect the control over the risks, the principal’s contribution margin, fixed costs, and return on OBSA are reallocated to the manufacturer (principal only keeps a return on its on-balance sheet assets). This scenario is outlined in Tables 14 and 15.
Table 14: ‘Dumb cash box’ P&L aligned with EPS
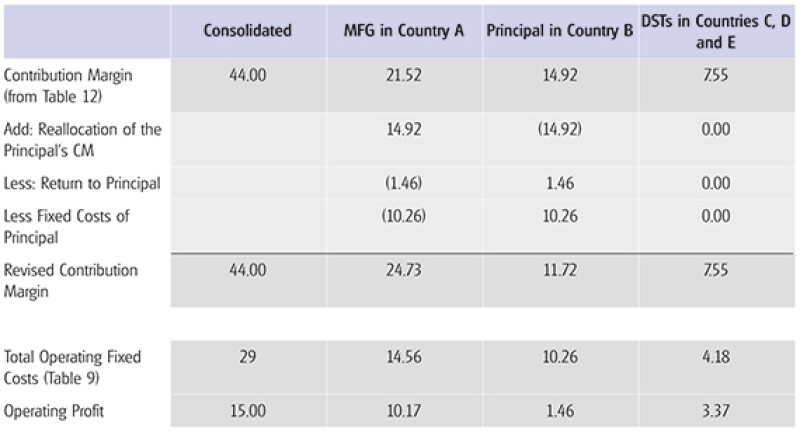
Table 15: ‘Dumb Cash Box’ transfer prices and P&L aligned with EPS

|
|
Shanto GhoshPrincipalTransfer pricing Deloitte Tax LLP Boston, USA Tel: +1 617 437 3761 Shanto Ghosh is a principal in Deloitte's Transfer Pricing practice in the US and is based in Boston. He has more than 18 years of transfer pricing experience and leads Deloitte's transfer pricing team in the Greater Boston area. Shanto has significant experience in advising clients from the life sciences, technology, media and telecommunications, and industrial products sectors. He has been actively involved in assisting clients with their global transfer pricing policy and documentation, and has implemented a number of large-scale global supply chain restructuring projects. He has significant experience in assisting clients on transfer pricing litigation and dispute resolution strategies and has been recognised in Euromoney/Legal Media Group's World's Leading Transfer Pricing Advisers four times in a row. He is a frequent speaker at international conferences across the globe and has published a number of high-profile articles. He has advised the government of India on transfer pricing policy matters and has also been involved with the OECD and the WCO in joint discussions related to the interplay between customs and transfer pricing valuation. In addition to his consulting experience, Shanto is a visiting lecturer at Brandeis University and has been a teaching fellow at the Harvard Institute of International Development and a lecturer of Financial and Development Economics at the University of California, Berkeley. He has a PhD in economics from Boston University, an MA in economics from the Delhi School of Economics, and a BSc from the University of Calcutta. |

|
|
Arindam MitraPrincipal, global transfer pricing Deloitte Tax LLP 555 12th Street, NW Washington, DC 20004 Tel: +1 202 879 5670 Arin is a transfer pricing principal based in Deloitte's Washington National Tax Group with over 20 years of professional experience. He serves some of Deloitte's largest clients in advisory role. He recently returned from Tokyo, where he served as the deputy managing principal of Deloitte Tax Japan and the Regional Leader for Transfer Pricing in Asia Pacific. Before serving in Tokyo he led Deloitte's Washington National Tax based transfer pricing team. He primarily focuses on complex business model optimisation engagements dealing with inter-company transactions involving intellectual property, and management, functional and supply chain rationalisations. He has published extensively on these topics. He has been recognised by Euromoney and International Tax Review as a leading transfer pricing adviser for a number of years. Arin is currently engaged in applying innovative financial techniques for analysing corporate value chains, consistent with OECD BEPS guidance. He has successfully resolved several large transfer pricing controversies and has negotiated over 40 bilateral APAs involving the US, Japan, Canada, Australia and India. He has a PhD in economics from Brown University and is a Chartered Accountant. |