The manufacturing sector continues to be the chief wealth-producing sector of the global economy and involves a large volume and variety of complex cross-border transactions, including tangible property, intangible property, services and financial transactions. The nature of inter-company transactions evolves as multinational enterprises (MNEs) adapt to the transformation of the sector through renewed business models and value chains to improve their agility within the rapidly changing environment. Because of the large size of cross-border transactions, proper transfer pricing planning is important for MNEs in managing not only their tax risks, but more importantly their financial results. At the same time, because of the volume and increasing complexity of intercompany transactions and their significant impact on tax revenue base, the sector has attracted and will likely continue to attract high levels of attention and scrutiny from tax authorities around the world.
The manufacturing sector continues to grow on a global scale. Global manufacturing output rose by 5.1% (3.3% in industrialised countries and 9.4% in developing and emerging industrial economies) in the first quarter of 2014, the highest rate in several years. This rate was supported by high growth in the production of durable goods, such as household equipment, electronic goods and motor vehicles, according to the UN Industrial Development Organization's (UNIDO) "Global manufacturing recovering but growth prospects for developing and emerging industrial economies remain fragile," June 11 2014, http://unido.org/news/press/global-economie.html.
The manufacturing sector is a diverse sector consisting of many industries and employs a large share of the labour force around the world. The sector provides products that are required by industries of strategic importance, such as national infrastructure and defence, as well as products that are indispensable in our daily lives. Many governments; therefore, are adopting more strategic approaches in making investments and policy decisions that are necessary to achieve overall economic prosperity through the promotion of the innovation capability and to become competitive in the manufacturing sector.
MNEs in the manufacturing sector should continue to navigate through the risks arising from uncertainty in factors such as material prices, government regulations, political climate, currency exchange rate movement and consumer demand. In addition, rapidly expanding global markets, technological advances and the aftermath of the Great Recession of 2007 to 2009 present many MNEs with a series of transfer pricing challenges, some of which involve traditional issues that continue to be debated in the tax and business community, whereas others are relatively new issues that increase the level of uncertainty in transfer pricing risk and global business management, and may require a fresh look at traditional transfer pricing approaches.
This article discusses key trends in five primary industries in the manufacturing sector and provides an overview of newly arising transfer pricing challenges resulting from the transformation of the sector. The insights provided should help MNEs prepare for the increase in complex transfer pricing issues challenging the manufacturing sector.
Key trends by industry
Aerospace and defence industry
The global aerospace and defence (A&D) industry revenue growth rate declined from 5.9% in 2012 to 3.1% in 2013, according to Deloitte Touche Tohmatsu Limited's "2014 Global Aerospace and Defence Sector Financial Performance Study" published in July 2014. Despite the slowdown, the industry still added US$21.4 billion in revenues, the second largest annual increase over the last five years. Total global industry revenues exceeded US$700 billion, an overall record, with improved operating efficiencies, higher profits and higher margins. This is the second year in a row that industry growth was above global GDP growth, which in 2013 was 2.2%. Rate increases for commercial aerospace, new product introductions and a flattening of government defence spending rates in the United States and Europe are expected over the next few years. Therefore, it is likely that above-average revenue growth will continue, driven largely by growth in commercial aerospace, where long-term increases in demand for travel, specifically in China, India, and the Middle East, as well as the need for more fuel-efficient aircraft, appear to support the view that aircraft sales demand and production volume is likely to grow.
Although US companies continue to dominate the A&D industry, it is becoming more global. US-based sector companies account for 59% of A&D global industry revenues. European-headquartered companies represent 34.2% of total revenues and the remainder was from companies headquartered in Brazil, Canada, Japan and other countries. Though this geographic makeup has been relatively constant for the past few years, over the longer term, US dominance has declined as non-US-based A&D companies continue to grow.
With the sector's increasing globalisation, many A&D companies are developing, manufacturing and selling some of their products in nondomestic markets. Thus, revenues based on a company's headquarters location will likely become less important, compared to where revenues are generated. Many US and European A&D companies have invested in manufacturing operations in China, Mexico, North Africa and Poland, as well as other geographies. This is significant because no major publicly held A&D companies are headquartered in those countries, yet a large number of workers are employed in the sector. Many European companies are generating increased revenues in the Middle East, the United States and other areas. Similarly, US companies are generating increased revenues in Australia, India, Japan, Saudi Arabia, South Korea, United Arab Emirates and other nondomestic markets.
Automotive industry
The automotive industry experienced a difficult volume decline in the recent economic downturn that started in 2007 with the US subprime mortgage crisis, followed by a notable comeback. In the United States, car and light truck sales climbed in June 2014 to a level not seen since before the financial crisis that led to the bankruptcy of two of the Detroit Big Three auto makers. Growth is also particularly strong in China, which is now the largest market by volume globally, according to the Wall Street Journal's "China's passenger Car Sales Rise by 21% In September," October 11 2013. Even European volumes are rising in 2014, for the first time in six years ("European Car Sales Continue Bumpy Recovery," Wall Street Journal, July 17 2014.). By 2012, global auto industry profits among top automotive makers were higher than in 2007, the last pre-crisis year ("The Road to 2020 and Beyond: What's Driving the Global Automotive Industry?" by McKinsey & Company, August 2013). In 2007, 53.2 million passenger cars were produced worldwide, whereas in 2013, that number increased to 65.4 million ("Worldwide Automobile Production from 2000 to 2013 (in Million Vehicles)" by Statista, via http://www.statista.com/statistics/262747/worldwide-automobile-production-since-2000/).
Major enablers of the automotive sector's performance include the GDP of the BRIC countries (Brazil, Russia, India and China), per capita disposable income around the world, oil prices and input prices. Rising incomes in the BRIC countries led to an increase in the demand for motor vehicles. Western auto makers moved production facilities to the BRIC countries to tap into those markets and benefit from low-cost labour. Looking forward, the automotive industry in more mature economies (Japan, the United States and Western Europe) is expected to grow relatively slowly, while emerging economies will grow faster. Global car and automotive manufacturing industry revenue is forecasted to grow to US$2.6 trillion in 2018, according to IBISWorld's "Industry Report C2531-GL: Global Car and Automobile Manufacturing," published December 2013.
The automotive industry's globalisation trend is expected to continue. Increases in international trade accounted for about a third of all revenue movements during recent years, according to the IBISWorld report, and industry globalisation is reflected in the operation of offshore and outsourced locations. With globalisation, many large auto makers have promptly adapted to the needs of individual markets by shifting production to those countries and by forming alliances with overseas manufacturers. Various forms of partnership exist between European, Japanese and US auto makers, including capital and technical tie-ups and joint R&D and production operations. Furthermore, major auto makers are pursuing relationships with local manufacturers in China, India and countries in the Southeast Asian region. We expect to see more mergers and acquisitions in this industry, particularly as auto makers expand operations in Eastern Europe, Southeast Asia and South America, seeking access to increasing demand in the emerging markets and cost reductions.
The industry is experiencing rapid changes, including notable technological innovations (such as increasing consumer preference toward connectivity in vehicles), tightened environmental requirements (for instance, significant pressure to develop more fuel-efficient and alternative fuel vehicles) and specific features of emerging markets, including the rise of new players in the emerging markets. The impact of these changes on MNEs in the automotive industry is expected to be encouraging. High-tech equipment, such as in-vehicle telematics that provide drivers with instant safety and communication services as well as "infotainment" services, are expected to become a standard feature in vehicles in the near future. Practical applications also include voice-assisted driving directions, vehicle failure detection and vehicle-to-vehicle communications to confirm vehicles keep a safe distance from each other to avoid collisions. Many auto makers will likely invest and engage in R&D activities to develop more fuel-efficient vehicles, and relevant technologies may include fuel cell technology in hydrogen-powered vehicles, ethanol vehicles and plug-in hybrid electric vehicles. Auto makers are increasingly pressured to develop global platforms upon which vehicles are designed, engineered and produced, to initially leverage the most capital-intensive equipment and resources, and later localise them for regional preferences. To carry on and succeed, auto makers must nimbly recognise the evolution of consumer vision and preference.
With these new developments and trends, the automotive industry is transforming from a traditional vertical structure to a more horizontal structure whereby auto makers may procure electronic components from semiconductor companies or obtain network services from telecommunication companies to respond to changes in consumer preference toward greater fuel efficiency and connectivity in vehicles. As the automotive sector invests significantly in the development of hybrid and electric vehicles, as well as in telematics, companies that did not historically supply products to auto makers may become major suppliers to the automotive industry. These recent developments have changed the landscape of the automotive industry, and it is important for manufacturers to identify cross-industrial and cross-regional opportunities, while being aware of business and tax requirements across industries and markets.
Chemical industry
The petrochemical manufacturing industry serves an important role in the global economy, because its products are used as fundamental building blocks to produce consumer and industrial products. The US petrochemical industry experienced a significant decline in revenues following the 2007-2009 recession, but it gained traction in 2010 with a 47% increase in industry revenue, according to "IBISWorld Industry Report 32511: Petrochemical Manufacturing in the US," published in April 2014.
An important factor influencing the petrochemical manufacturing industry is downstream demand, and the performance of the manufacturing sector has a significant bearing on industry performance. The recovery of the general economy and market demand, coupled with the boom in the production of natural gas – a key input for the petrochemical manufacturing industry – due to the proliferation of fracking and horizontal drilling in the United States in recent years, have also helped chemical industry profit margins considerably, rising from 5% of revenue in 2009 to 15.2% in 2014, according to the IBIS industry report.
The abundance of natural gas and its comparatively cheap price compared with alternative raw materials, such as crude oil, has also attracted manufacturers further downstream. Over 90 chemical and plastics projects have been announced in North America, totalling US$71.7 billion in private capital investment in new plant and equipment by 2020 ("Magnet Industry Reports: Chemicals – North America," February 2014, Magnet, Inc.). This is also supported by increases in fixed asset investments in the chemical products industry in the United States, which grew from US$95.9 billion in 2007 to US$106.6 billion in 2012. ("Investment in Private Fixed Assets by Industry" by US Bureau of Economic Analysis.)
As lower key input prices continue to provide US-based manufacturers with a significant competitive advantage relative to other regions in the world, foreign-based chemical manufacturers are expected to shift production to the United States to remain competitive. For example, Germany's BASF SE, the world's largest chemical manufacturer by revenue, has doubled its annual average investments in its U.S. plants to US$1 billion a year in 2012 ("BASF Steps Up Investment in U.S.: Economic Recovery, Shale-Oil Boom Spur a Shift for the Chemical Giant," Wall Street Journal, December 17 2013), and Sasol Ltd., a South African integrated energy and chemical company, invested about US$21 billion in at least nine Louisiana plants that are expected to begin production in 2017, according to the 2014 Magnet Industry Report on Chemicals in North America. To counter the inherent reliance on regionally tied key raw materials, such as natural gas and crude oil, many chemical manufacturers are spreading their operations globally, switching between countries and regions to procure cost-advantaged feedstock to help alleviate the effects of highly volatile energy prices. "IBISWorld Industry Report 32511: Petrochemical Manufacturing in the US," April 2014.
Industrial products industry
The growth in the industrial products manufacturing industry is constrained by the pace of GDP growth; hence, the economy's growth rate is a determining factor for the performance of this industry. The US economy grew at a 3.1% rate between the fourth quarter of 2012 and the fourth quarter of 2013, according to the "National Income and Product Accounts Gross Domestic Product: Second Quarter 2014 (Advance Estimate)," by US Bureau of Economic Analysis. Growth is expected to continue until 2017. After 2017, the growth rate is expected to slow to a rate of 2%, according to the Congressional Budget Office's Budget and Economic Outlook, 2014-2014, published February 2014.
The European economies also have experienced growth since the second quarter of 2013. The EU economy is expected to grow in the short term, but at a slower pace than that of the United States. Forecasted growth rates for the EU are 1.5% in 2014, 1.2% in 2015, and 1.8% in 2016, according to the European Commission's European Economic Forecast, Winter 2014. Likewise, Japan's growth rate is expected to remain stable at around 1.5% until 2016. Among emerging market economies, the picture is mixed. There are continued signs of weakness in Russia and Brazil, some stabilisation at more sustainable growth rates in China, and an improved outlook for India.
Given the dependence of the industrial products manufacturing industry on overall economic growth, this sector is expected to experience slow (when compared to historical averages) but steady growth in the next few years. In addition, the global landscape of the industrial products industry might be further influenced in the upcoming years by three trends: rising interest rates, re-shoring of US manufacturing and innovation in manufacturing processes. Should the increase in interest rates be larger or more rapid than expected, the resulting disruption to both US and worldwide economic growth could significantly affect this industry, according to Top Industry Trends to Watch in 2014, GE Capital Americas, http://www.americas.gecapital.com/insight-and-ideas/capital-perspectives/top-industry-trends-to-watch-in-2014.
Global economic trends are having a large impact on the industrial products industry. One trend that is expected to be reversed is the offshoring of US manufacturing. According to The Boston Consulting Group, the United States is expected to witness a manufacturing resurgence due to a shrinking wage gap with China. Net labour costs for manufacturing in China and the United States are expected to converge by 2015. This has led some companies to bring manufacturing back to the United States, as discussed in Top Industry Trends to Watch in 2014.
Another factor likely to influence the resurgence of US manufacturing is the ongoing downward trend of natural gas prices. Since 2005, wholesale prices of natural gas in the United States have decreased by over 50%. Natural gas currently costs more than three times as much in China, France and Germany than in the United States, and nearly four times as much in Japan. Boston Consulting Group estimates that by 2015, natural gas will account for only 2% of average US manufacturing costs and electricity will account for just 1%. By contrast, natural gas and electricity combined will account for between 7% and 13% of manufacturing costs in Japan and in Europe's major exporting economies, and about 6% in China. This decrease in energy prices will make the US manufacturing industry more competitive globally, and likely bring back to the United States some manufacturing jobs that were sent offshore in the previous decades.
Metals industry
The metals industry supplies a wide variety of other industries and markets with key manufacturing inputs. Demand in the metals industry is volatile, because it supplies a wide range of highly cyclical industries such as construction, motor vehicles and machinery industries. Therefore, the performance of the metals industry is influenced by changes in the general economy and consumer demand that impact these downstream industries. Among these, construction and motor vehicle industries represent two of the largest downstream markets for the metals industry, and demand from those markets is anticipated to drive steel consumption in particular, according to "Magnet Industry Reports: Metal Works – North America," May 2014, Magnet, Inc. Other key industry factors include the prices of energy and other key inputs, such as crude oil and natural gas.
The price of nonferrous metals increased rapidly prior to the recession of 2007-2009 due primarily to the strong growth in the US construction industry, as well as the rapid industrialisation of China and India. As the recession spread across the globe in 2008 and 2009, however, average prices for nonferrous metals fell by 14.2% relative to 2008 prices, as construction demand in China, India and the United States plummeted ("IBISWorld Business Environment Report: Price of Nonferrous Metals," February 2014). Demand for nonferrous metals quickly rebounded in 2010 as the global economy gradually recovered from the recession. Price growth for nonferrous metals is expected to level off to an annualized rate of 4% from 2014 to 2019, because of excessive investment in mines before the recession and slower growth in China and the United States, according to the Magnet Industry Report.
The demand for aluminium, the third most used material in motor vehicles after steel and iron, has grown significantly in recent years as auto makers seek to improve fuel efficiency. This demand is likely to continue to grow as consumers become more environmentally conscious, and auto makers strive to design more fuel efficient motor vehicles by shedding weight. The US market for aluminium sheet, which totalled less than 200 million pounds in 2012, is expected to total one billion pounds in 2014, according to the Magnet Industry Report on Metal Works in North America. While auto makers' shift to lighter materials has created competition for traditional raw materials such as steel, steel will likely remain an important input for the automotive industry due to its competitive advantages in cost and mass production. "IBISWorld Industry Report 33111: Iron & Steel Manufacturing in the US," April 2014. This increased focus on light-weight material has also facilitated the development of new steel products, such as the ultralight steel auto body.
While US production of steel has risen in recent years, China remains the single largest supplier of crude steel, accounting for 49.2% of crude steel production globally. Thus, US manufacturers of steel and iron face global competition, with a sizable portion of US demand satisfied by foreign-based suppliers. The presence of US-based steel and iron manufacturers abroad has also increased as demand for steel and iron continue to be driven by emerging markets such as China and India, according to the IBISWorld Industry Report.
Common operating structures in the manufacturing sector
Manufacturers' operating structures are often described by the following commonly used terms according to their risk profiles and economic characterisations: (i) entrepreneur; (ii) licenced manufacturer; (iii) contract manufacturer; and (iv) toll manufacturer. Although the boundaries between these terms are sometimes unclear and they may oversimplify complex manufacturing profiles, these terms summarising manufacturer risk and functional profiles are often useful in describing typical transfer pricing issues associated with the manufacturing sector. We provide practical illustrations of these four operating structures and associated intercompany transactions below.
Entrepreneur/full-fledged manufacturer
An entrepreneur, or a full-fledged manufacturer, may be responsible for activities such as production planning, input procurement, supply chain management, quality control, long-term capacity utilisation planning and potentially selling to third-party customers. A full-fledged manufacturer that possesses routine intangibles bears a range of risks associated with those activities, such as product liability, warranty, capacity utilization, market demand and pricing risks. A full-fledged manufacturer/entrepreneur also may be engaged in significant R&D activities, bearing risks associated with development, maintenance and protection of valuable intangible property that may result from the R&D activities.
An entrepreneur manufacturer earns returns on routine functions (including routine manufacturing operations) and on its contribution toward valuable intangibles. For example, in a simplified model with one entrepreneur and many nonentrepreneurial entities in an MNE group's value chain, nonentrepreneurial entities (such as limited-risk entities) earn returns on routine functions based, for example, on benchmark profitability established from functionally comparable companies. The entrepreneur receives all residual profits or losses from the value chain. In this system, the nonentrepreneurial entities' profitability tends to be relatively stable, as it is subject to a fixed benchmark profitability range, whereas the entrepreneur manufacturer's profitability can vary significantly (reflecting the entrepreneur's higher risk profile) in line with the group's aggregated profit level. This profit-based transfer pricing framework works well when there are sufficient profits in the group's value chain. If there are group losses, the manufacturer entrepreneur will incur all group losses, and this framework may create "phantom taxable income" at the nonentrepreneurial entities by assigning routine profits to them. Under difficult circumstances (such as the significant economic downturn witnessed in 2008-2009), the relative reliability of this profit-based framework may appear poor in comparison to alternative approaches, such as a profit splits/loss splits.
Licenced manufacturer
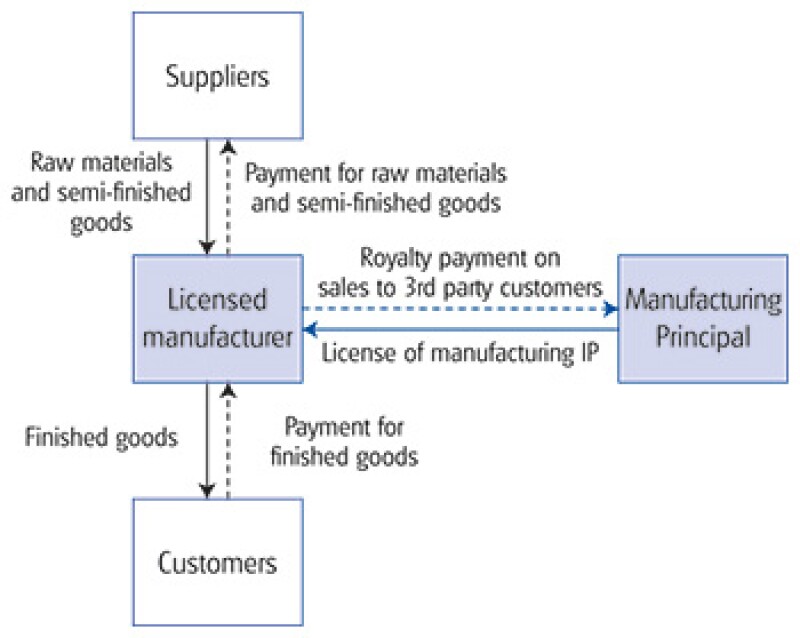
A licensed manufacturer produces goods under a licence agreement, using manufacturing intangibles owned by the licensor, such as patents, product designs, manufacturing process and know-how. The licenced manufacturer pays royalties for the use of the licenced intangibles, typically buys raw materials and semi-finished goods on its own account and holds inventories of the raw materials and finished goods. Therefore, it bears the risks associated with both holding inventories and selling products, including demand and pricing risk. The licenced manufacturer typically owns plant and equipment necessary for manufacturing operations and invests in training its labour force.
Exhibit 1 Illustration of licenced manufacturer structure |
|
Exhibit 2 Illustration of contract manufacturer structure |
|
Exhibit 3 Illustration of toll manufacturer structure |
|
As illustrated in Exhibit 1, intercompany transactions under this framework often include tangible property transactions, intangible property transactions and services transactions that may be highly interrelated. For example, in its manufacturing operations, a licenced manufacturer may use specially designed equipment purchased from the licensor, high-quality components supplied by the licensor, valuable production process know-how developed and owned by the licensor, valuable testing services, technical support and quality assurance protocols provided by the licensor. The licenced manufacturer's operating profits; therefore, are driven by value derived from tangible property, licenced intangible property and services. In profit-based transfer pricing analysis, in particular, it is important to recognise the potentially interdependent nature of multiple intercompany transactions and consider review of results aggregating several categories of intercompany transactions. Compensation for a licenced manufacturer is often best determined as a limited-risk return in line with industry benchmarks established from functionally comparable manufacturing companies' operating results.
Contract manufacturer
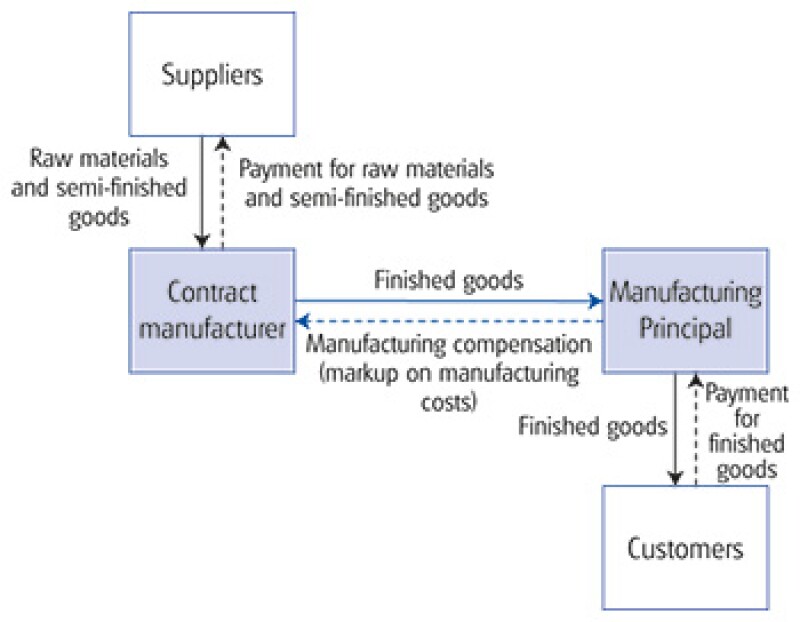
A contract manufacturer is generally thought of as less risky than a typical licenced manufacturer. The contract manufacturer produces goods for a manufacturing principal that directly bears demand and final customer pricing risk. Provided the products made by the contract manufacturer comply with the principal's product and quality specifications, the principal may guarantee to purchase the goods. Therefore, the contract manufacturer may bear relatively limited risks associated with holding finished goods and selling them, compared with a licenced manufacturer. The contract manufacturer typically owns plant and equipment and procures/owns raw materials, and thus still bears the risks associated with holding fixed assets and raw material inventory. In many instances; however, a manufacturer may perform some "contract manufacturing" activities that are ancillary to its licenced or full-fledged manufacturing activities.
As illustrated in Exhibit 2, a typical intercompany transaction between a manufacturing principal and a contract manufacturer is the contract manufacturer's sale of manufactured goods to the principal. The contract manufacturer is compensated by the principal typically through a return to enable the contract manufacturer to earn an arm's-length mark-up on total costs, that is, a return on value-added manufacturing services reflecting a return on its capital investments and investments in raw material inventory.
Toll manufacturer
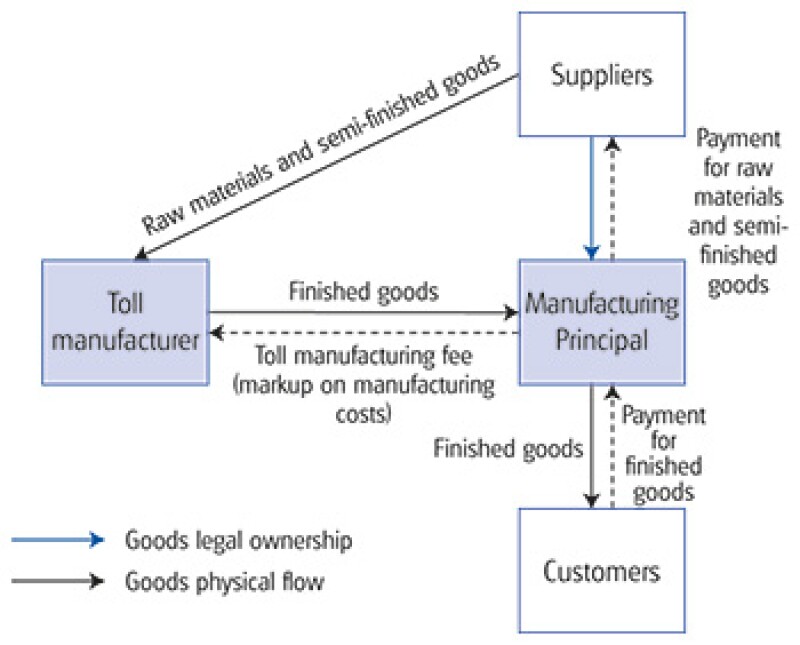
Under a toll manufacturer framework, the principal retains title to the raw materials, work-in-process and final products during the manufacturing process. As illustrated in Exhibit 3, the related-party manufacturing principal owns raw materials and makes them available to the toll manufacturer for processing (that is, the toll manufacturer does not take title to raw materials). The toll manufacturer performs processing services, and is compensated by the manufacturing principal through a toll manufacturing fee that is typically calculated as a mark-up on processing costs. The manufacturing principal bears the risks associated with holding raw materials and finished goods inventory, as well as final demand and price risks.
Transfer pricing issues in the manufacturing sector
The nature of intercompany transactions in the manufacturing sector continues to evolve as MNEs adapt to the transformation of the sector through renewed business models and structures to attain operational efficiencies and agility to meet the changes, as well as better access to growing demand. At the same time, traditional transfer pricing issues in the manufacturing sector continue to be important in addressing transfer pricing risks. Those traditional issues include:
Comparable selection challenges (lack of "good" comparable companies in some industries and geographic regions, requiring the performance of challenging comparability adjustments);
The interdependence of various transactions (integrated transactions requiring aggregation or "bundled" approaches over a relatively long industry/product cycle);
Issues related to location-specific factors (for example, conflicting views between tax authorities and taxpayers particularly, with respect to the allocation of net benefits derived from the factors); and
Issues related to restructuring (for example, articulation and documentation of economic substance of certain restructuring transactions, such as the conversion from licenced manufacturer to contract manufacturer).
These relatively traditional issues continue to be widely debated in negotiations with tax authorities around the world and explored in research papers.
This section focuses on new transfer pricing challenges arising with the transformation of the manufacturing sector, and provides an overview of anticipated issues, including: (i) a potential shift from a single tested party to a multiple tested party framework; (ii) a trend toward region-focused business models from centralised models with the globalisation of the sector; and (iii) rapid technological innovation and its implication for MNEs' intangible property strategies.
From single tested party to multiple tested party framework
The Great Recession, which officially started in December 2007 and ended in June of 2009, according to the National Bureau of Economic Research (NBER), impacted all industries, but the severity, timing and duration of impact varied substantially throughout the different industries. Durable goods manufacturing, including transportation equipment (including motor vehicles), fabricated metal and machinery, were among the hardest hit. Many notable MNEs in those sectors reported significantly decreased sales and profits relative to pre-recession years, or operating losses on a consolidated basis during the recession. In such difficult business conditions, when there is no group profit (or very low profit), we witnessed a significantly heightened risk of phantom taxable income creation among MNEs that had previously implemented a transfer pricing policy based on a historically, widely accepted single tested party approach, such as the comparable profits method (CPM).
A single tested party approach is an approach to set a profitability benchmark (usually a range) for the entity that performs more limited functions and bears more limited risks relative to the other entity engaged in the intercompany transactions. If a licenced manufacturer (a subsidiary) in country A is expected to earn a minimum functional return (for example, at least 2% operating profit margin) under a CPM-based transfer pricing policy while there is no aggregate profit for a licensor –the parent company in country B and its subsidiary – does the licensor reduce royalty charges to the subsidiary to allow the subsidiary to earn 2% margin?
To answer this and similar questions, MNEs must consider how to treat and quantify the impact on profitability, for transfer pricing purposes, of factors such as significant sales declines, asset impairment resulting from recession-induced sales declines, restructuring expenses resulting from plant closures and personnel layoffs forced by the recession, capacity underutilisation due to reduced production volume and in some instances, potential impact of significant currency exchange rate fluctuations. MNEs must carefully analyse if the subsidiary is "free" from the risks associated with all these factors. Under these circumstances, tax authorities in country A may assert that there is no reason to deviate from the company's policy and the subsidiary will earn 2% margin in light of its relatively limited risk profile regardless of the group's overall profitability, whereas tax authorities in country B will assert that the royalty payment will not be reduced because the intangible property remains valuable and the losses are due to uncontrollable, extraordinary factors – the unprecedented economic downturn.
Many recession-affected MNEs encountered the choice between (i) continuing with the single tested party policy to "create" phantom taxable income in the countries where relatively limited risk entities operate, and (ii) deviating from this transfer pricing policy (that was implemented in pre-recession years) at the risk of inviting challenges from the tax authorities of the countries where the limited-risk entities are located. Single tested party policies presented their limitations and challenges in practice under extraordinary circumstances. As we approach the extreme ends (good or bad) of the spectrum of business circumstances, the ambiguity of the definition of "limited-risk" entity becomes important in transfer pricing planning.
A multiple-party risk-sharing framework may be more consistent with the tenor implied by the OECD's BEPS initiative. As indicated in the "Action Plan on Base Erosion and Profit Shifting" issued July 19 2013, the OECD emphasises value creation in highly integrated groups and recognises the need for greater transparency to evaluate and limit potential disconnects between where money and investments are made and where MNEs report profits for tax purposes. To encourage transfer pricing outcomes with appropriate returns earned where commercial value is created, the BEPS initiative suggests that it may become necessary to review an entire value chain and review functions and risks of each entity in the value chain, rather than taking two entities in the chain at a time and determining a profitability benchmark for the entity whose functions and risks are more limited than the other.
The country-by-country reporting template proposed in the "Discussion Draft on Transfer Pricing Documentation and CbC Reporting" the OECD issued in January 2014 (and subsequently revised in response to comments received on the January draft) calls for MNEs to organise important information (such as sales, cash tax paid, and tax accrued) by country or by business division in a template, which can be shared among different countries' tax authorities through the exchange of information provision of relevant tax treaties. A profit/loss-split-based pricing policy (that covers a whole value chain) may be suitable in an environment where greater transparency in a value chain is expected.
Centralised model vs. region-focused model
One significant implication of operations in emerging markets is the impact on how certain manufacturing industries operate. Historically, heavy R&D activities tend to be performed and centrally managed by an MNE group's headquarters (HQs), or at a parent company level. Foreign subsidiaries in emerging market locations tend to perform some engineering and R&D activities, but those activities are often limited to "localisation activities" and are distinguished from "core" R&D activities that are performed at HQs. In addition, to achieve efficiency and realise economies of scale, some key manufacturing assets and intangibles (such as automotive "platforms") have become global, whereby designs are used globally, and quality IT systems, and other important commercial functions are managed on a global basis rather than regionally or by country.
By contrast, consider the automotive sector in India. India's per-capita GDP is still small, but vehicle unit sales were growing by double digits every year after the recession until recently, when low economic growth, high interest rates, and fuel prices have slowed down car sales, according to "Car sales in India down for 2nd year running; job loss pegged at 1.5 lakh," The Times of India, April 11 2014. The Indian car market is currently dominated by three firms – Maruti Suzuki, Tata Motors and Korea-based Hyundai. The Detroit Big Three and Japanese Big Three original equipment manufacturers (OEMs) have very small market shares there, while Suzuki, the early entrant to the Indian market, has benefited significantly from its first-mover status in the market and its partnership with India's national company.
The Indian passenger car market is also characterised by the significant popularity of compact cars for their ability to turn in a small radius, high manoeuvrability in congested streets and affordable prices. See "The Automotive Industry: At the Threshold of a New Era: Potentials and Challenges in the Fast-Growing Indian Automobile Industry" by Deloitte Tohmatsu Consulting, October 2010. For many Indian consumers, purchasing a passenger car is a major decision and consumers place greater importance on word-of-mouth information, in addition to direct communications with dealers. Therefore, each maker must consider designing a sales network strategy that takes into account its relationship with local business partners, as well as competitors' sales network, to reach out to the targeted consumers. On the product planning side, car makers must adapt to Indian consumers' value for money principle, define necessary specifications and R&D activities in India, and, if necessary, depart from the quality standard that Big Three auto makers have adhered to on a global scale. Certain standard features in the United States may not be necessary in India.
To expand business in certain sectors in India, such as the automotive sector, manufacturers may need to resort to a region-specific, more decentralised strategy to establish an effective sales network and product planning that is appropriate for the distinctive Indian market. MNEs may have better agility to adapt themselves to the developments in emerging markets through a regional HQ model than a global HQ model. With a more decentralised business model to allow distinctive, region-specific product development and marketing strategies in some markets, a multitude of transfer pricing questions will arise: which entities will own the intangible property that may result from R&D and/or marketing activities performed at a regional HQ? What functions will be moved to the regional HQ, and what functions will be shared between the parent and a regional HQ? How should the value chain be transformed? Which entity will be responsible for making additional investment and finding qualified labour/engineers? What functions will be outsourced?
Innovation and intangible property strategy
Innovation capability is an important strategic capability for many manufacturers. Consumers demand innovation, and new products are introduced regularly. In the automotive sector, in addition to major vehicle model changes every four to five years, rapid technological innovations, such as hybrid power, enhanced safety features and smart computing continue to generate consumer interest. Hybrid electric technologies will continue to evolve and hybrid vehicles may be expected to gain greater mass-market relevance in the future. At the same time, auto makers are developing all-electric vehicle technology, and battery performance and cost are changing rapidly.
Automotive manufacturing illustrates that distinctive and challenging transfer pricing issues may result from innovation. According to a survey conducted by Deloitte Consulting, about 37% of respondents indicated that they want to stay as connected as possible while in their vehicles and 44% of those aged between 18 and 24 years rated connectivity as very important. Many drivers are already performing a variety of connected tasks in our cars, such as making phone calls and using navigation systems. But the survey respondents indicated connectivity beyond communications, such as entertainment content, remote vehicle control and remote diagnostics, are desirable. The connected vehicle industry continues to evolve and is affected by a number of factors, such as emerging technologies, consumer interests and demands, and connected service alternatives. Complex cross-industrial questions are arising: Should car makers offer free content in exchange for personally directed advertising? How to mitigate the liability risk of driver distraction? How to manage in-vehicle advertising? How to collaborate with electronics companies for hardware? How to collaborate with network companies? How to address the significant differences in product cycles (for example, network technology cycle, automotive body cycle, battery technology cycle)?
The implications for most auto makers and their business collaborators in response to these trends are significant and result in a number of new challenges. Convergence between the automotive, communications and technology industries is relatively new. Historically, automotive OEMs developed vehicle technologies in a relatively closed manner and at a more deliberate pace that mirrored vehicle development cycles. This new trend presents automotive OEMs opportunities to consider business models that focuses on safety and performance, and another that focuses on entertainment. Automotive OEMs have accelerated the development of new technologies, infrastructure, business models and marketing strategies to support those emerging services.
From a transfer pricing perspective, this trend can present complex issues: Who owns the marketing intangibles relevant to the telematics? Is it a service or are distinctive intangibles created? Where were the telematics R&D activities performed? The connected vehicle industry is likely to continue to mature over the next 10 to 15 years, and auto makers will likely be experimenting with new technologies and new infrastructures and developing required business models to deal with this trend.
Governments around the world have been instructing that vehicles become significantly more fuel efficient over the next several years. Consumers' expectations for range, charge time and purchase prices for green, fuel efficient vehicles, such as hybrid vehicles, plug-in hybrid vehicles and electric vehicles, are rising. China, Europe, Japan and the United States are all actively pursuing advances in technologies in this area. The US and Chinese governments in particular have actively supported the advancement of technologies in this area. Technologies required for these new types of vehicles are very different from those required for traditional vehicles. No internal combustion engines and no transmissions are necessary, but battery and motor technologies are critical. Historic engine components required broad ranging coordination among parts suppliers and makers at the design stage, and this requirement for design coordination know-how and relationship with OEMs was a critical commercial characteristic in the automotive sector. R&D and manufacturing operations for electric vehicle components are more like modules and assembly of modules. The traditional design arrangements for the industry may change dramatically. For example, Tesla Motors, an electric vehicle venture based in Silicon Valley, procures important parts such as batteries from a Japanese company and motors from a Taiwanese company, as opposed to traditional vertical (Japanese Keiretsu, captive) structures with the OEM at the top. A number of transfer pricing issues may arise in this new dynamic value chain for the next generation of fuel-efficient vehicles.
Conclusion
The manufacturing sector is becoming global and increasingly cross-industrial. New market challenges and opportunities arising from the expansion of global markets and rapid innovations, together with the efforts toward operational efficiencies based on the lessons learned from the Great Recession and competitive pressures, are transforming the manufacturing sector. The transformation has driven many MNEs in the manufacturing sector to revisit their business/value chain structures and transfer pricing policies. Tax authorities of many countries are continuing to review MNEs' intercompany transactions closely. MNEs that proactively align their operations and address transfer pricing issues associated with the changes will be better positioned to successfully operate through this increasingly complex environment, and such proactive approaches can eventually contribute to MNEs' operating results and growth.
Kaoru K. Dahm |
||

|
|
Principal Deloitte Tax LLP 1001 G Street, NW, Ste. 1200 Washington, D.C. 20001 Tel: +1 202 378 5274 Kaoru K. Dahm, Ph.D., is a principal in Deloitte Tax LLP's National Tax Office in Washington D.C. At Deloitte, Kaoru is a Global Tax & Legal Manufacturing Industry leader, as well as a co-leader of the US Transfer Pricing Team Automotive Industry Group. She is also a US leader of Deloitte Japanese Services Group Transfer Pricing Network. Kaoru has undertaken and supervised transfer pricing studies for advance pricing agreements, tax planning and corporate restructurings, cost sharing arrangements, intangible valuation, transfer pricing compliance and documentation, headquarters cost allocation, transfer pricing audit support, and other projects for a variety of industries, including the pharmaceuticals, chemical, biotech, e-commerce, medical equipment, automobiles and automobile parts, computer software, industrial machinery, construction equipment, energy, and semiconductor sectors. While at Cal-Tech, Kaoru designed and wrote computer programmes to simulate stochastic processes in financial studies and conducted numerous computerised experiments in the field of economics and finance. Kaoru has been recognised as one of the world's leading transfer pricing advisors in Euromoney's "Expert Guide to the World's Leading Transfer Pricing Advisers" and in "Expert Guide to the World's Leading Women in Business Law: Transfer Pricing." Her publications (with co-author(s)) in professional journals include "New Services and Intangibles Regulations: IRS Changes the Mix" in Tax Management Transfer Pricing Report (August 16 2006), which was also published in Tax Management International Journal (Vol. 35, No. 11, 11/10/2006), "A Framework for Analyzing Transfer Pricing under U.S. FIN 48" in International Taxation (Vol. 28, September 2008), "Is It Time to Revisit Transfer Pricing Planning?" in Tax Notes International (March 8 2010), and "Similarities and Differences in U.S. and Japanese Transfer Pricing Documentations" in Kokuzei Sokuho (June 10 2011). Kaoru is a frequent speaker at business and professional conferences. Education
|
Richard Sciacca |
||

|
|
Director Deloitte Tax LLP 1001 G Street, NW, Ste. 1200 Washington, D.C. 20001 Tel: +1 202 879 5664 Dr. Richard Sciacca is a Deloitte Washington National tax director and senior economics advisor for its National Advance Pricing Agreement (APA) and Competent Authority (CA) Group. Richard is responsible for the development and economic analysis of intercompany pricing strategies for multinational companies, particularly in the APA and CA context, but also in complex tax planning, global documentation, and contentious audit and litigation projects. He is known among transfer pricing professionals as an evidence-driven and research-guided, innovative problem solver. Richard's numerous working relationships with tax authority APA and CA professionals are regularly called upon in helping to design, implement, and expeditiously resolve APA and CA cases. Richard has been working on transfer pricing projects for the past 20 years and has specialised in APAs for the past seven years. His project experience includes more than 75 APAs, and in his former position with the IRS APA Office, he was the lead economics negotiator in complex bilateral negotiations with several tax authorities. He is co-leader of Deloitte's TP Automotive Industry Group, and is currently an APA and economics adviser to US, Japanese, and Korean automotive OEM and supplier APA clients. He also served as the APA Programme's Pharmaceutical Industry Group principal economist, and is currently an APA and economics adviser to well-known biotech and pharmaceutical clients. At the APA Programme, he was also the principal economist in coordination meetings with many tax authorities. Before his IRS APA experience, Richard was a Deloitte transfer pricing economist principal for 12 years. His clients included numerous Fortune 500 companies doing business throughout the world. He has advised companies in many industries, and specialises in the automotive industry, health care and life sciences. He has successfully defended clients in audits conducted by the tax authorities, and is particularly experienced in working with attorneys from leading international law firms. Richard also has significant litigation experience, serving as an expert witness in more than 20 actual and potential commercial litigation and transfer pricing cases. Richard is actively involved in training, and he developed training materials for Deloitte's US and global transfer pricing practice as well as for the IRS APA Programme. |