In a previous article in this series, we described the necessity of rethinking transactional net margin method (TNMM) studies and enhancing them with economic analysis. NERA Economic Consulting Managing Director Yves Hervé and Associate Director Philip de Homont describe how economic adjustments can be used to improve the quality of benchmarking analyses.
TNMM is used to test the operating margin of a company (the tested party) with available third-party information of companies performing comparable functions, assuming comparable risks and using comparable assets (comparables). This automatically puts comparability at the centre of any benchmarking study: Is a distribution company in France comparable to one in Poland? Are car suppliers' manufacturing activities comparable to those of agricultural machinery suppliers?
Adjustment calculations for benchmarking studies are necessary to increase the comparability of the tested party with the selected comparables. Every company follows its own specific business strategy, impacting the transfer pricing system, and is subject to a different market environment. These differences impact the profitability of the tested party and can be quantified to increase the reliability of the benchmarking analysis and the comparability to the selected comparable companies.
Adjustment calculations in distribution benchmarks
In the following example, a multinational company's distribution activities are performed by a related distribution company and a related local commissionaire/sales agent. The product prices and sales commission are the tested transfer prices, and are tested by comparing the operating margin (EBIT/revenues) with third-party data using TNMM analysis. The functional analysis shows that both types of entities (distributors and commissionaires) perform virtually the same activities and that the contract negotiation is performed by the commissionaire. Even though the contracts are legally signed at the parent company, the sales agents should be considered the economic owners of the customer relations. Consequently, the commissionaire's operating margin is calculated by dividing the entity's EBIT by the revenues for which it receives the commission payments (and which are booked by the parent company).
There are important differences in the physical assets owned and the transaction flows between the two types of entities and the selected comparables. The sales agent does not own the inventories and has no accounts payable or receivable. Additionally, there might be significant differences between the accounts of the distribution entities and the selected comparables due to different business strategies (e.g. giving longer periods for the payment of products vs. prepayment, or just-in-time delivery vs. larger inventories with spare parts). The differences can be quantified.
Working capital, inventories, accounts receivable, and accounts payable impact the profit and loss statement, as they can be redefined as costs. A distribution company has funds bound up in these accounts and cannot invest them with a financial return. The costs associated with owning inventories and accounts receivable, and paying accounts payable, is quantified by calculating the hypothetical economic alternative of investing these funds in a riskless asset for some time. This way, the difference in remuneration between a distribution company and a commissionaire can be quantified. Using these economic adjustments, commissionaires can be tested using TNMM benchmarks. Additionally, differences between the tested party and the selected comparables can be calculated and adjusted in the same way.
Graph 1
Adjustment calculations in manufacturing benchmark analyses
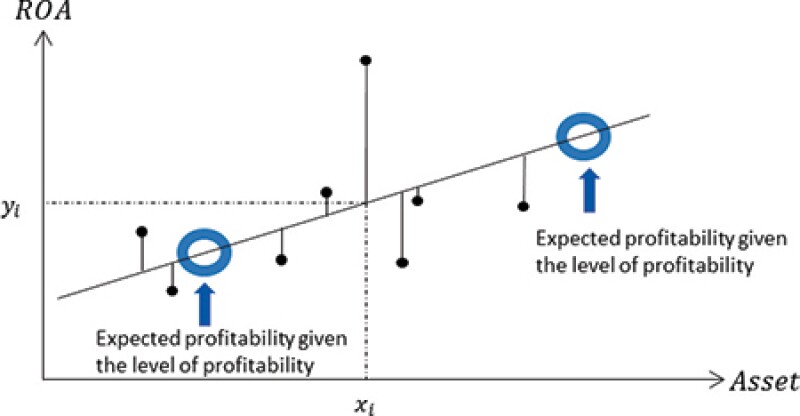
Large adjustments can also be justified for contract manufacturers or other producing entities for which economies of scale can be demonstrated. In some industries, such as energy, the larger the production or generation volume of a contract manufacturer, the more efficiently it can use its assets. Selected comparables in a manufacturing benchmark analysis typically vary significantly in their assets. Adjustment calculations can be used to compare companies with different assets. Using statistical analysis, the relationship between assets and profitability can be analysed, as shown in Graph 1.
In this example, there is a statistically significant relationship between the asset values and the return on assets. This statistical relationship can be used to adjust the operating profits of the tested parties to the average asset size of the selected comparables. For example, the average asset size in a sample is €100 million ($115 million) and the tested party only had assets of €30 million. The statistical analysis shows that an additional €10 million of assets implies an additional return on assets of 0.2%. Therefore, the tested operating return should be increased by 1.4% ((100-30)/10×0.2%) to ensure comparability of the tested party with the selected comparables. Such an adjustment is also helpful to explain differences in the profitability of several related manufacturing companies with different operational sizes.
Conclusion
The comparability between the tested party and comparable companies determines the reliability of TNMM studies. The qualitative screening of comparable companies alone cannot eliminate all differences between the tested party and the selected comparables. As illustrated in this article, remaining differences (e.g. in terms of contractual details or company size) can often be controlled for in a quantitative statistical analysis, thus enhancing the quality of the TNMM study.