The global economic landscape is being reshaped by trade tensions, supply chain disruptions, and macroeconomic volatility. This article explores how these developments challenge the reliability of current transfer pricing (TP) models and the economic analyses on which they are based. It presents a framework for assessing whether legacy TP methods remain defensible and outlines how these TP models may be changed to become more resilient to economic and business turbulence – such as using a return on assets (ROA)-based transactional net margin method (TNMM), profit splits, and comparable uncontrolled prices.
While a full model overhaul may not yet be necessary, multinationals should prepare for more frequent changes to ensure constant compliance and efficiency of their TP models in a rapidly evolving environment.
Background
Economic analysis is a cornerstone of every applied TP engagement. It underpins the defensibility of intercompany pricing arrangements and ensures alignment with the arm’s-length principle. However, conducting such analysis is usually complex and nuanced, and should not be based on one-size-fits-all procedures.
It is usually acceptable to perform the core economic analysis once per transaction, even if the transaction spans multiple years. Updates are usually carried out by refreshing comparable data. Consequently, it takes a lot to compel multinational groups to revisit and revise their TP models as regards the methods, the economic and functional assumptions, or the types and sources of input data. And this may be necessary to properly address market and business turbulence.
The robustness of economic analysis depends heavily on several key elements (see paragraph 3.4 of the OECD Transfer Pricing Guidelines for Multinational Enterprises and Tax Administrations, 2022, or the OECD TP Guidelines):
The complexity of the analysed transaction as regards the functions, assets, and risks of the counterparties;
The availability and reliability of comparable data (internal and/or external); and
The TP method most appropriate for the analysed transaction, and required comparability adjustments.
When these foundational elements are disrupted, the reliability of the analysis is compromised. In such cases, legacy TP models may no longer yield defensible, arm’s-length outcomes.
Trade tensions and supply chain disruptions directly and indirectly undermine these elements. Directly, they alter cost structures and profit allocations within multinational enterprises (MNEs). Indirectly, they render legacy TP methods ineffective or even misleading, as historical comparables often fail to reflect how independent parties would respond to such shocks.
These developments necessitate a re-evaluation of economic analysis for TP.
Trade tensions and supply chain disruptions – such as the COVID pandemic, the imposition of increased tariffs, global shipping disruptions, rising interest rates, and persistent inflation – may constitute commercial developments significant enough to warrant a change in TP analysis. This article proposes a framework for evaluating whether the legacy TP models used so far may still be applicable and provide arm’s-length outcomes, and if such developments warrant revising existing TP models.
The nature of these changes will be explored, the continued viability of legacy TP policies will be assessed, and alternative methods or adjustments that may be more appropriate in the current environment will be examined. This sets the stage for a deeper dive into the specific changes affecting TP.
Changes
Trade tensions and supply chain disruptions have triggered a cascade of effects across global markets. Chief among these are rising costs and prices – not only for energy, materials, labour, and services (illustrated in the charts below) but also for capital, as inflation and interest rates climb in tandem.
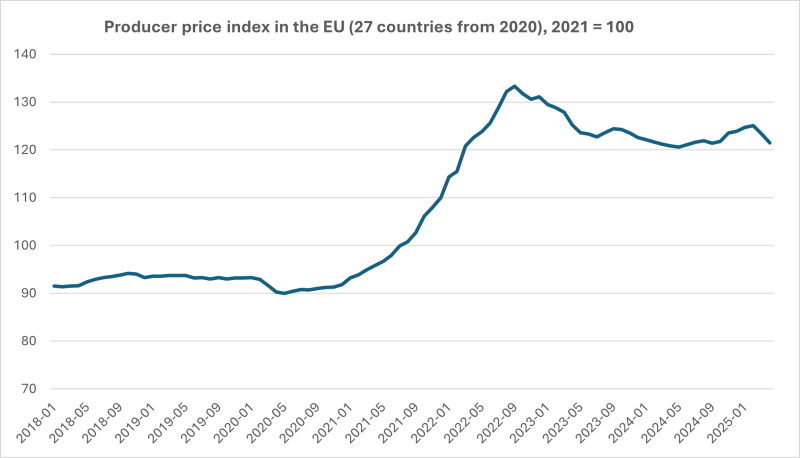
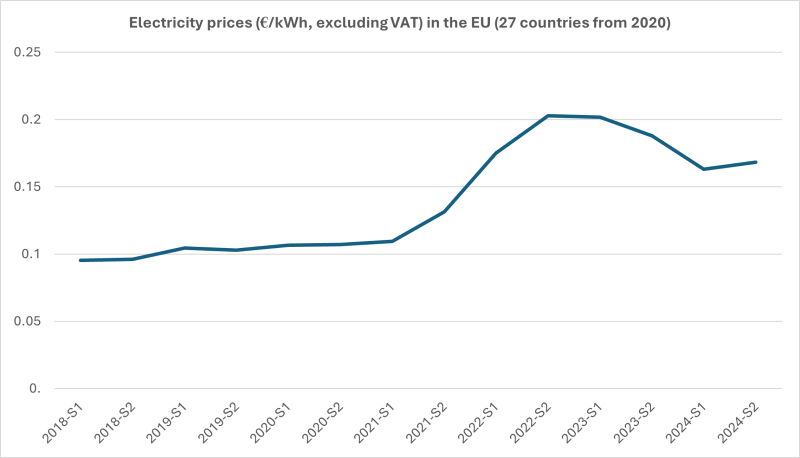
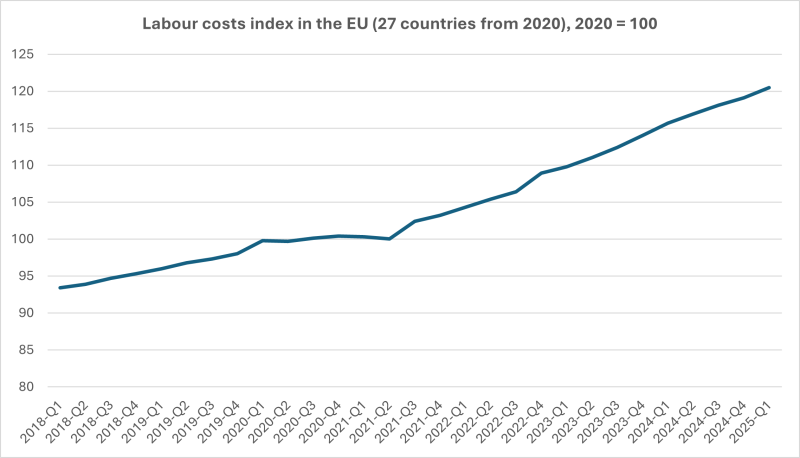
The significant changes in costs illustrated above, considered a rather theoretical possibility until recently, challenge the assumptions underpinning earlier TP models. A critical consideration in evaluating the continued relevance of economic analysis for TP is how these increased costs and prices are passed on – or not – outside the MNE in question.
Where manufacturers or distributors in the market absorb increasing costs of energy, labour, etc., their profitability should decrease. Consequently, profit markups of contract manufacturers or distributors operating in multinational groups should also decline – following trends observed in comparable market data. Conversely, where market circumstances allow such cost increases to be passed on to clients, comparable data should show that the profit markups or margins of managed-profit entities should stay the same.
As market turbulence unfolds, the availability and relevance of comparable data become increasingly problematic. This is especially true for the TNMM, which often relies on private company EBIT data that may lag by up to two years. In the worst-case scenario, TP for current disruptions could be based on outdated data from previous inflationary periods or even the COVID era (see paragraph 3.68 of the OECD TP Guidelines). This means that now it is not possible to say how comparables, whose data is used for calculating markups and margins in intragroup transactions, deal with increasing costs of energy, labour, etc. – whether they pass them on or absorb them.
These developments lead us to consider the consequences of relying on legacy TP models.
Consequences
To illustrate the implications, consider a simplified MNE structure comprising managed-profit entities – contract manufacturers, distributors, and shared service centres. Contract manufacturers are typically remunerated using the TNMM, earning an EBIT markup on fully loaded costs. Distributors earn an EBIT margin on third-party sales. The ‘entrepreneur’ captures the residual profit; i.e., the difference between total supply chain profits and the remuneration paid to contract manufacturers, distributors, and shared service centres.
Assuming stable volumes (i.e., no supply shortages or demand shifts), the impact of rising costs and prices is straightforward. Profits of contract manufacturers increase because their markup is applied to a higher cost base. Similarly, unless the group reduces prices (which is unlikely), distributors’ profits also rise. Consequently, the entrepreneur’s residual profit must decrease to accommodate the increased profits of routine entities.
If the entrepreneur’s effective tax rate (ETR) is relatively low compared with that of other group entities, this shift results in a higher overall ETR for the group, as profits move from low- to high-tax jurisdictions. Thus, standard TP models with managed-profit entities become less effective in turbulent times when trade tensions or supply chain disruptions occur.
Even if volumes decline, the percentage-based profitability of routine entities remains constant unless they incur losses (unlikely under an EBIT-based TNMM). Therefore, the fundamental issue persists: legacy TP models may no longer yield appropriate outcomes.
The next section explores alternative methods and adjustments to address these challenges.
Conclusions
Market turbulence means that TP models should be reviewed as regards their principal assumptions and sources of input data. This is needed to ensure the reasonability of outcomes, which otherwise may be strongly disturbed. The following changes may be considered to increase the resilience of legacy TP models to economic turbulence (mainly inflation).
EBIT margins and markups within the TNMM may be replaced with other profit indicators, such as ROA, return on capital employed (ROCE), or weighted average cost of capital. The Berry ratio may also be considered, which uses distribution costs (and not energy or material costs, both of which have been strongly affected by inflation recently) as a denominator.
By replacing EBIT markups and margins with more inflation-resilient profit indicators, multinationals may reduce the impact of cost inflation on TP and prevent the allocation of even more profits to contract manufacturers or distributors. This is because assets or capital, if used as a basis for calculating profits allocated to managed-profit entities, should not change as much in turbulent years as costs. Obviously, using ROA, ROCE, or other indicators will not eliminate the problem related to unavailability of up-to-date comparable data from the analysed period (which may be completely different from the historical data and depend on the absorption of increasing costs by comparable entities operating on the market).
Illustrative example
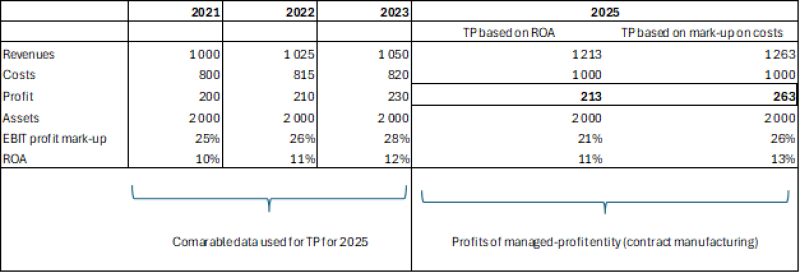
At the other end of the spectrum, profit split methods are less affected by trade disruptions. However, economic disruptions in turbulent times raise questions about whether existing profit splits accurately reflect the value contributed by risk management functions. This may necessitate redefining the profit base (e.g., from total to incremental) or considering loss-sharing mechanisms.
Real-life examples of profit splits in turbulent times are emerging. For instance, recent trade tensions between the US and China meant that tariff burdens in many cases were shared between retailers and manufacturers aiming to smooth price increases rather than passing all the costs to clients. In some cases, this worked until the tariffs became too high. Some multinational brands decided to fully absorb duties on imports from Asia and keep prices stable to gain market share. Dairy and grain price swings caused by crop shortfalls in 2022 resulted in the renegotiation of supply contracts by quick-serve restaurants and the implementation of two-tier pricing, with base prices locked in for several months and any excessive increases split equally. Jet fuel cost increases post-2021 were absorbed by several carriers to some extent to maintain competitive prices.
These examples show that under market conditions, counterparties share the effects of market and business turbulence. Similarly, if related parties apply comparable logic, their behaviour may be considered arm’s length – provided it is adjusted to the circumstances of each transaction and the magnitude of the changes is sufficient to warrant renegotiation of the set-up.
Comparable uncontrolled prices remain a gold standard, if available. Their continued applicability must be verified through rigorous economic analysis, especially under current market conditions. However, extra effort may pay off, with transfer prices much closer to the market prices and capturing the effects of inflation and its absorption almost immediately.
The TNMM may be refined by applying differentiated markups: a higher one on value-adding costs and a lower one on other costs. This is akin to converting a contract manufacturer to a toll manufacturer, which mitigates the impact of input price inflation without the complexity of a full model change. Effectively, an increase of costs should, to a lesser extent, translate into increases of profits of managed-profit entities. However, this requires an added administrative burden, since more TP studies would be required – for each group of costs separately marked up.
Illustrative example
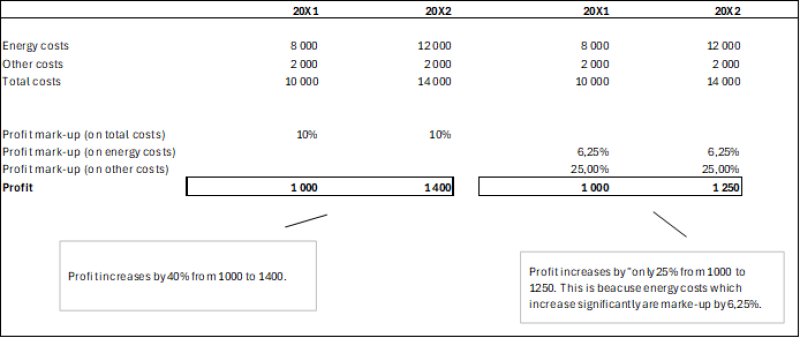
Other methods also require adjustments. Comparable prices may need to reflect contractual rights to respond to tariffs or inflation. Profit splits may be revised piecemeal or comprehensively; for example, by equalising returns on costs across the supply chain. These adjustments demand transaction-level comparable data.
Data and implementation
Whether the method and profit indicator are changed or remain unchanged, the parameters must still be revisited. This is especially true when adopting new methods. Past experience, such as COVID-related adjustments, offers valuable guidance. Insights from audits and advance pricing agreements or mutual agreement procedures are particularly useful.
The TP landscape is becoming increasingly fragmented. This is evident in the growing number of court cases and the proliferation of soft law, both internationally (e.g., the OECD TP Guidelines) and in specific countries. Country-specific requirements such as detailed criteria for TP benchmarking analyses, update frequencies, and compliance documentation further complicate implementation.
A persistent challenge is the lag in comparable data, as seen during COVID. To address this, public data, which is available earlier, may be used and correlated with private data to identify early indicators. Economic indicators such as purchasing managers’ indices, interest rates, and GDP growth can also provide useful signals.
Transfer prices may therefore be adjusted preliminarily based on such public data or macroeconomic indicators and then again with a delay of one to two years. Otherwise, if historical comparable data is eventually used and not updated, the TP may be substantially incorrect, even if more inflation-resilient profit indicators are used (which only minimise the cost-inflation effects but do not ensure that the profitability of managed-profit entities is within the range of profits of comparable entities in that fiscal year, as discussed in paragraphs 3.67–3.83 of the OECD TP Guidelines).
Summary: is it time to revise existing TP models?
Recent developments in trade and supply chains are significant enough to warrant a stress test of existing TP models. Economic analysis should first assess the materiality of these changes and their impact on legacy models. Standard TNMM-based approaches may lead to higher ETRs or increased scrutiny.
Multinationals should explore TP methods and techniques (within technical processes of calculating transfer prices and regarding adjustments to comparable data) that are more resilient to market and business turbulence and produce outcomes aligned with strategic goals and stakeholder expectations. While TP models based on comparable market prices or profit splits are less likely to produce distorted results, they require rigorous validation and are usually much more complex in proper implementation. If the TNMM is used, more economic analysis is needed – to test the continued relevance of comparable data.
Perhaps the most promising area for innovation lies in adapting the TNMM to use ROA or ROCE. While it may be premature to overhaul TP models entirely, flexible approaches such as partial conversions or hybrid models may offer a practical interim solution.
In conclusion, the need for economic analysis is not only greater now but also more complex. Multinationals must be prepared to invest in more sophisticated approaches to navigate the turbulent times ahead.
Deloitte refers to one or more of Deloitte Touche Tohmatsu Limited (DTTL), its global network of member firms, and their related entities (collectively, the “Deloitte organization”). DTTL (also referred to as “Deloitte Global”) and each of its member firms and related entities are legally separate and independent entities, which cannot obligate or bind each other in respect of third parties. DTTL and each DTTL member firm and related entity is liable only for its own acts and omissions, and not those of each other. DTTL does not provide services to clients. Please see www.deloitte.com/about to learn more.
This communication contains general information only, and none of Deloitte Touche Tohmatsu Limited (DTTL), its global network of member firms or their related entities (collectively, the “Deloitte organization”) is, by means of this communication, rendering professional advice or services. Before making any decision or taking any action that may affect your finances or your business, you should consult a qualified professional adviser.
No representations, warranties or undertakings (express or implied) are given as to the accuracy or completeness of the information in this communication, and none of DTTL, its member firms, related entities, employees or agents shall be liable or responsible for any loss or damage whatsoever arising directly or indirectly in connection with any person relying on this communication. DTTL and each of its member firms, and their related entities, are legally separate and independent entities.
© 2025. For information, contact Deloitte Global.


