The OECD’s new emphasis on aligning profits with value creation through the conclusion of the BEPS Action Plan has resulted in an evergrowing number of companies facing the challenge of preparing documentation that includes detailed value chain analyses and justifies transfer pricing (TP) policies.
New disclosure requirements coupled with tax authorities’ increased scrutiny on economic basis means value chain analysis will be vital for companies when planning and defending TP policies in the future. While identifying and defining value chains has not historically been of such importance, this article offers taxpayers and TP professionals a five-step process for conducting value chain analyses, spanning from gathering and organising necessary information to ultimately defining the value chain(s) that underpin the operations of multinational enterprise (MNE) groups.
Five steps for value chain analysis
1) Collect the raw data and information; 2) Identify entities and process functions; 3) Connect the entities and functions; 4) Value the links in the chain; and 5) Create a diagram for documentation. |
1) Collect the raw data and information
A qualitative and quantitative approach to retrieve and organise the raw information necessary for value chain analysis is recommended.
Surveys and interviews (Qualitative)

• Entity - level functions performed • Entity - level risks incurred • Entity - level assets employed |
Statistical and financial calculations (Quantitative)

• Transactional volumes • Existing TP calculations • Entity - level financial results |
The surveys and interviews with personnel should focus on discovering the functions performed, risks incurred and assets employed by the group’s entities. Financial reports, invoices and contracts should be gathered as well to shed light on transactional volumes, profit margins and third-party arrangements.
2) Identify entities and process functions performed
Supply chain operations reference (SCOR) is a model developed and endorsed by the Supply Chain Council and many Fortune 500 companies to describe the business activities associated with satisfying customers’ demand. Since its development in 1996, SCOR has become the standard cross-industry, diagnostic tool for supply chain management.
The model is used to ensure all essential functions and the corresponding entities are taken into consideration for analysis. Using the information gathered in step (1), taxpayers can create a SCOR model. To develop the model, one should list entities involved with each process function starting from ‘Plan’ and ending with ‘Return’ (see Table 1). The model is used to organise the essential information collected in step (1). After completing the SCOR model, the information will be mapped onto a value chain in step (3).
Table 1: SCOR process modelling template
Process function |
Definition of process function |
List entities |
Plan |
Processes that balance aggregate demand and supply to develop a course of action which best meets sourcing, product and delivery requirements (E.g. logistics, planning, corporate management) |
– |
Source |
Processes that procure goods and services to meet planned or actual demand (E.g. procurement, warehousing) |
– |
Make |
Processes that transform product to a finished state to meet planned or actual demand (E.g. manufacturing, refining) |
– |
Deliver |
Processes that provide finished goods and services to meet planned or actual demand (E.g. transportation, distribution) |
– |
Return |
Processes associated with return or receiving returned products and support activities (E.g. customer support, IT, accounting) |
– |
3) Connect the entities and functions
Michael Hammer, a former professor of computer science at Massachusetts Institute of Technology (MIT), pioneered business process redesign (BPR) as a business management strategy to help better support an organisation’s mission and reduce costs. One development resulting from the use of BPR analysis is the implementation of a value map worksheet that connects functions with the legal entities of a multinational’s business.
The worksheet goes one step deeper than the SCOR model by organising specific functions with the corresponding entity, as well as showcasing the depth of an entity’s relevant functions. The rows and columns can be expanded as needed to accommodate even the largest, most complex value chains.
Careful thought and planning should be used when defining the functions performed by the multinational’s entities to accurately depict and delineate economic substance; Figure 1 illustrates how a standard function, distribution, can carry varying amounts of involvement for an entity. A generic template for a value map worksheet is illustrated in Table 2.
|
Table 2: Value map template 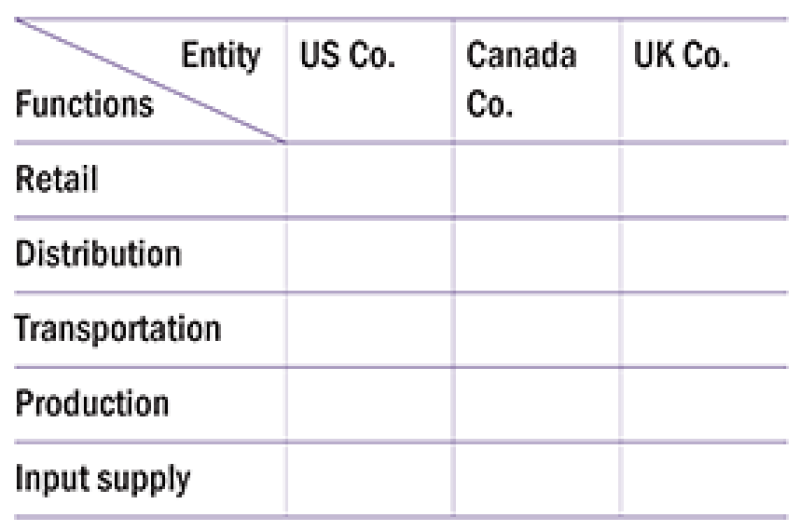
|
|
Figure 1: Accurately defining functions in relation to economic substance 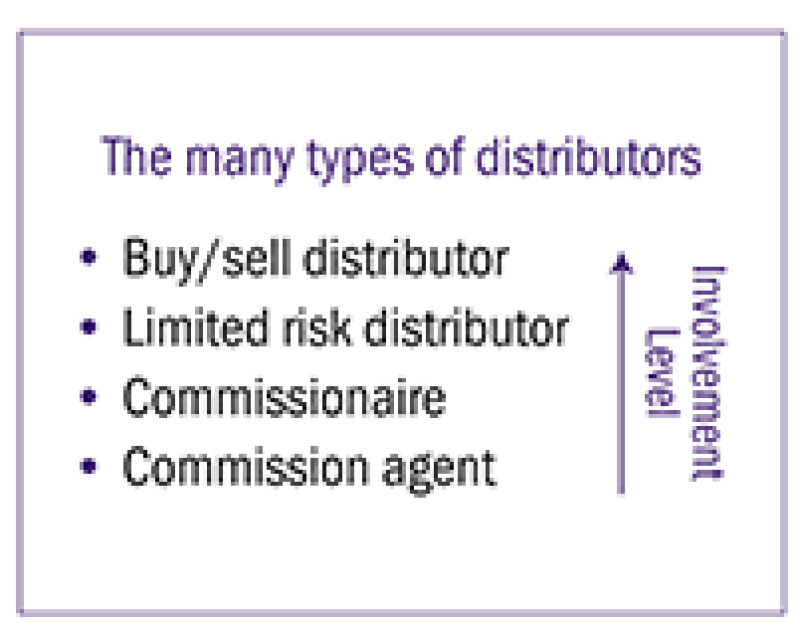
|
4) Value the links in the chain
In addition to identifying the links comprising a company’s global value chain, a compliant master file should also describe contributions of value creation by individual entities within the group in a brief written functional analysis (i.e. a high-level analysis of key functions performed, important risks assumed and important assets used by group entities that partipciate in the value chain).
The portfolio purchasing model (PPM), developed by Peter Kraljic, can provide a valuable framework to assess relative magnitudes of value contribution by entities. Since its initial development, a variety of permutations have occurred to adapt it to all dimensions of the supply chain, including demand profiling, products and throughput rate.
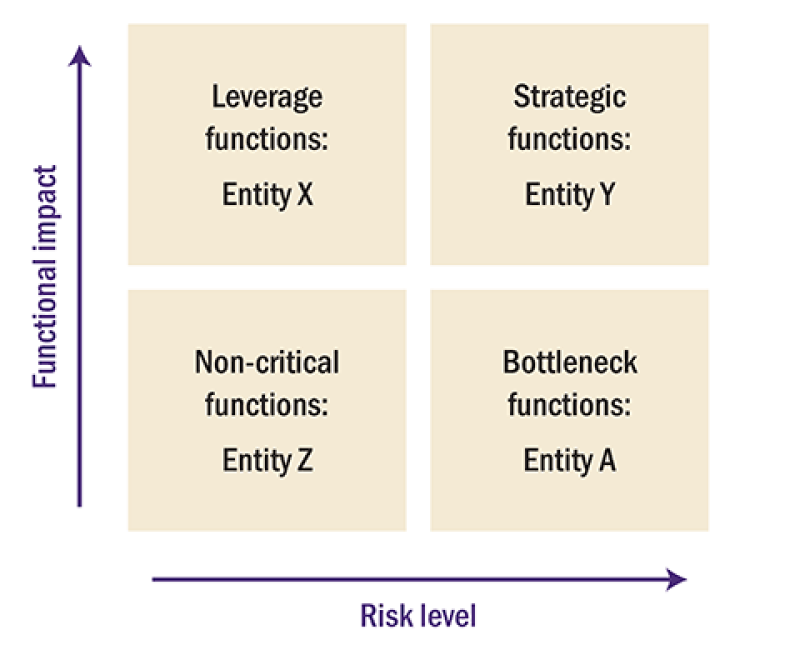
Taking these variations of the model into account, a version suited for value chain evaluation for the purposes of TP can be created by replacing the specific items with the actual functions performed by an entity and profits by the impact of the function on performance as illustrated in Figure 2. The four quadrants can then be defined as:
Leverage functions: Functions that have high impact on performance (e.g. branding);
Non-critical functions: Functions that are rudimentary and low risk (e.g. freight-forwarding);
Strategic functions: Functions that are high risk and high impact (e.g. research and development activities); and
Bottleneck functions: Functions that have low impact but high risk (e.g. location-restricted activities).
Figure 2: Modified PPM matrix
5) Create a diagram for summary
The guidelines introduced in Action 13, and codified in Appendix I to Chapter V of the OECD Guidelines, recommend a diagram to show the value chain of a multinational’s five largest products and any other products and/or services amounting to more than 5% of group turnover. The specifics of the diagram are not outlined in the guidelines, but information necessary to illustrate include:
1) Geographic markets;
2) Functions performed by entities; and
3) Differences in risks assumed.
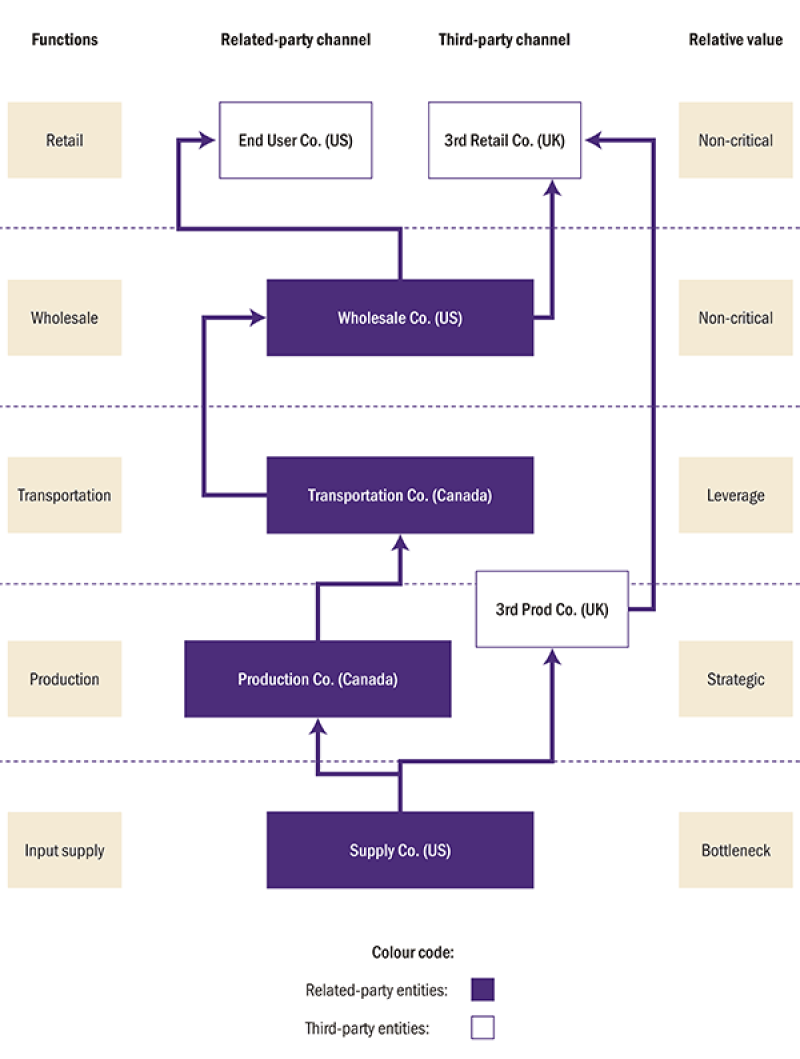
Constructing a cohesive diagram to organise the value-chain information gathered through the above steps, and thus meet the master file value chain information requirement, involves creating three columns: functions, channels and relative value.
The functions and relative value columns’ rows are populated by the information from the value map and the modified PPM illustrated in Table 2 and Figure 1, respectively.
The market channel column is used to differentiate related party activities from third party activities and will contain the entities involved with the corresponding function row. Figure 3 illustrates a generic example of a value-chain diagram produced using Bennett Thrasher’s five-step process – the final diagram used for documentation by taxpayers will typically need to be more detailed and specific.
Figure 3: Generic value chain diagram
Ben Miller |
|
|---|---|

|
Partner Bennett Thrasher T: +1 678 302 1483 Ben Miller is a partner at Bennett Thrasher, where he leads the firm’s TP practice. He works with clients to design, implement and maintain TP policies that align strategic business objectives with local and foreign TP rules and regulations. Ben’s experience includes evaluating the transfer prices of tangible goods, intangible property, services and loans for various purposes, including penalty protection documentation, planning, international supply chains and debt restructuring. He also has expertise on advance pricing agreements, audit defense and due diligence for mergers and acquisitions. His industry experience is broad based, with recent focus in manufacturing and distribution, technology, professional services and real estate. Ben holds bachelor’s degrees from the University of Florida, as well as a master’s degree and a doctorate in economics from Georgia State University. Prior to joining the firm, he worked in Deloitte’s TP practice where he assisted corporations operating in a variety of industries. He is currently the vice-chair, TP of the International Tax Committee of DFK International. |
Abbas Raza |
|
|---|---|

|
Supervisor Bennett Thrasher T: +1 770 790 3734 Abbas Raza is a supervisor in Bennett Thrasher’s tax practice. He has been with the firm for more than four years and has been involved with a variety of different tax, accounting and finance projects. Abbas assists clients in a number of industries, including entertainment, manufacturing and distribution, professional services and real estate. Abbas is a graduate of the Georgia Institute of Technology, where he earned bachelor’s degrees in business administration and economics. He is currently pursuing a master’s degree in economics from American University. Prior to joining the firm, he had the opportunity to work with several financial services firms in Atlanta and New York. |