

In order for taxpayers to comply with their transfer pricing obligations, they must demonstrate that their operations with related parties were agreed upon in the manner as they would have been conducted among independent parties in comparable operations, that is, consistent to the arm's-length principle. For these effects, a transfer pricing method must be selected based on the hierarchy established by Article 180 of the Mexican Income Tax Law (MITL).
In Mexico, the use of methods based on a comparison of profit margins had become popular using foreign comparable transactions/companies. This circumstance is due to the insufficiency in publicly available information of Mexican companies. In response to the use of foreign comparables, the Mexican tax authorities have followed the recommendations from the toolkit of the platform for collaboration on tax integrated by the OECD-UN-IMF-World Bank, and also from the Inter-American Center of Tax Administrations (CIAT) transfer pricing cocktail for a 'country risk adjustment'. This adjustment 'normalises' the comparison between Mexican and foreign companies through a mathematical formula that corrects the profitability of foreign companies by incorporating the effect that they had operated in Mexico.
The mechanics of the formula
The formula to this adjustment is published in the FAQ section of the Mexican Administrative Tributary System (SAT) as follows:
Country risk adjustment = average operating assets from the last years of the comparable company (located in a developed country) × EMBI (emerging market bond index) corresponding to Mexico.
Application of the adjustment
Comparable company sales + country risk adjustment
Facing the posture of the tax authorities, it is worth asking – is there a significant impact in the profit margins of the company due to its geographic location? Also – does the proposed formula respond to the theoretical demands of the tax authorities?
To answer the first question, we must consider if the proposed country risk adjustment responds to the presumption of risk to return. This concept implies that the location differences of the companies are a result of the exposure to different levels of risk and, as a response, these companies remain in these countries because they expect a return that adequately compensates for said risk exposure.
Therefore, the use of 'comparable' companies or transactions located in different locations merits the use of an adjustment in profit margins to annul the location effects on the margins, and hence increase the comparability in analysed transactions.
Considering that emerging countries are considered structurally to have more risk, the hypothesis of risk to return leads us to assume that emerging countries would have to offer larger returns than those obtained in developed economies.
To evaluate whether there is a statistical difference in returns among emerging countries and developed ones, QCG Transfer Pricing Practice has developed a comparative analysis to evaluate the returns of companies located in both emerging and developed economies. The approach is described in detail below.
Data extraction
For the initial comparative analysis, there was a search conducted in the Bureau van Dijk Osiris database (updated to March 2019) using the following criteria:
Active companies;
Companies with accounts from 2018;
Companies listed in a stock exchange;
Companies with a website;
Companies with available gross margin/cost of goods sold (C+) data;
Companies with available operating margin (OM) data; and
Companies located in the following countries:
Developed countries: Australia, Austria, Belgium, Canada, Denmark, Finland, France, Germany, Ireland, Italy, Norway, New Zeeland, Portugal, Singapore, Spain, South Korea, Sweden, Switzerland, the UK and the US.
Developing countries: Brazil, Chile, China, Colombia, Egypt, Greece, Hungary, India, Indonesia, Malaysia, Morocco, Mexico, Peru, Philippines, Poland, Russia, South Africa, Thailand, Turkey and Taiwan.
The search yielded a result of 7,609 companies.
As the purpose is to evaluate the differences in profit margins among companies in emerging countries, to those in developed countries in the same industry, the companies are classified by major group (major group according to the first numbers of the US Standard Industrial Classification (SIC) categorisation). For sub-groups, only those with at least 10 observations from companies in emerging and developed countries were used, respectively, yielding as a result 45 sub-industries and reducing the sample from 7,609 to 7,065 companies.
The analysis is also a function of two distinct ratios, the gross margin/cost of goods sold (C+) and operating margin (OM), to confirm the veracity of the sample using different financial indicators.
Kolmogorov-Smirnov test
To summarise the previous, the hypothesis evaluates whether the margins from companies in emerging countries have significant differences with those obtained by companies in developed countries. In this case, the Kolmogorov-Smirnov test is applied to find if the probability distribution in the margins of both groups is different for each sub-industry.
Where Fn(x) is the probability function defined as:
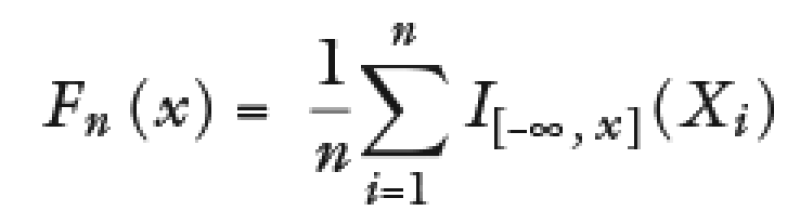
Where I[–∞, x](Xi) is the indicative function, equal to 1 if Xi ⩽ x is equal to 0, in other cases the statistical Kolmogorov-Smirnov is the following:
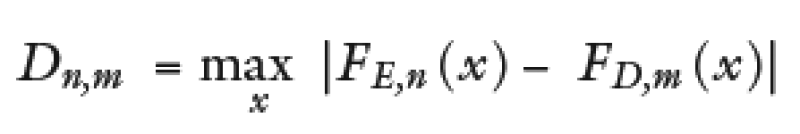
Where FE,n and FD,m(x) are the accumulated probability functions of the two samples that correspond to the group of companies in emerging countries and to the group of companies in developed countries, respectively.
The null hypothesis indicates that both samples present the same distribution and it is rejected if it meets the following:
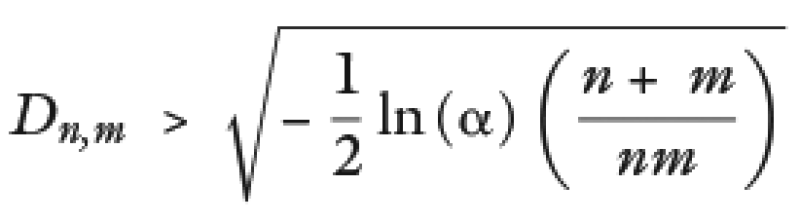
Where α corresponds to the confidence level (1–α)%.
Table 1 presents the results from the database where we can observe that in the case of both ratios only 9 of the 45 analysed sub-industries report that the Kolmogorov-Smirnov test rejects the null hypothesis. That is, the results indicate that we are far from observing a generalised or consistent difference among the distribution of margins from emerging countries to developed countries.
Table 1: Kolmogorov-Smirnov test results |
||
|---|---|---|
C+ |
OM |
|
US SIC that accepts the null hypothesis. |
01, 10, 13, 15, 17, 20, 22, 23, 24, 25, 26, 27, 29, 30, 34, 35, 37, 38, 39, 42, 44, 45, 48, 49, 50, 53, 57, 58, 59, 60, 62, 65, 70, 73, 79, 80 |
01, 10, 13, 15, 17, 20, 22, 23, 24, 25, 26, 27, 29, 30, 34, 35, 37, 38, 39, 42, 44, 45, 48, 49, 50, 53, 57, 58, 59, 60, 62, 65, 70, 73, 79, 80 |
US SIC that rejects the null hypothesis. |
16, 28, 32, 33, 36, 47, 51, 67, 87 |
16, 28, 32, 33, 36, 47, 51, 67, 87 |
Source: BvD Osiris. US SIC: indicates the first digits of the US SIC that correspond to companies included in the Kolmogorov-Smirnov test. |
||
With respect to the second question, it is important to remember that the risk-return hypothesis refers to a positive relationship among the expected return (not the one ultimately obtained) with risk or uncertainty in achieving this expected return. This is because the economic agents would definitely prefer an asset with a higher expected return than another when both have the same level of risk, and would also prefer an asset with a lower level of risk than another when both have the same expected return.
Consequently, only assets that hold a risk-return compensation relationship will 'survive' the market.
The most common metrics to measure the expected return is the mean, while in the case for risk the most common measure is variance, which indicates the levels of volatility.
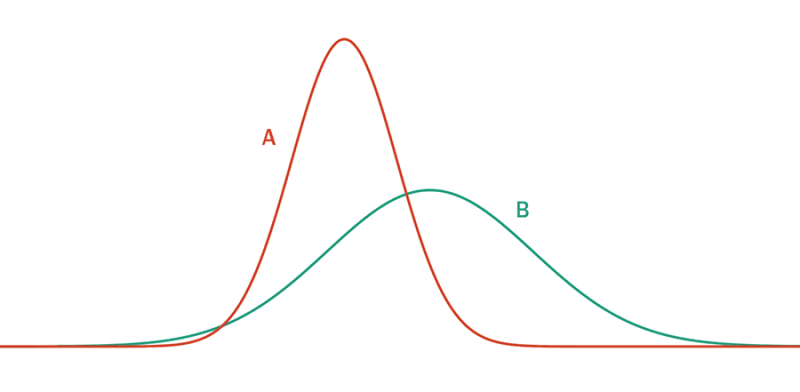
Graphic 1 shows the two corresponding distributions to different assets (A and B), where the function in asset A has a greater mean than the distribution function for asset B. The variance in the distribution of A is also greater than the variance to the distribution of B, noting the positive relationship among risks and returns in assets that remain in the market.
Graphic 1: Return distribution of A and B
On the other hand, to discuss the question of whether the country risk adjustment is necessary or not, one should consider that the way to carry out this adjustment is entirely consistent with the risk- return hypothesis, which is the theoretical concept on which the implementation is based.
The following presents a specific case where we will evaluate if the proposed country risk adjustment is consistent with the risk-return hypothesis described above.
Case study
Suppose that with respect to C+ the there are n comparable companies from country A (developed country) and the analysed company is in Mexico (country B). Country A has less risk than country B, that is, there are observations of comparables that correspond to the distribution A of Graphic 1 and with the adjustment, we seek to modify them to distribution B (corresponding to a country with higher risk) through the use of the adjustment formula.
If the country risk adjustment is correct, applying the adjustment must present an increase in the mean and the variance of the profit margins of these comparable companies.
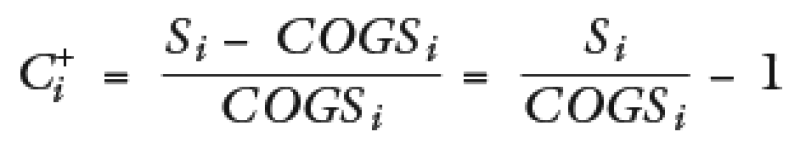
C+ formula before the adjustment (S = sales, COGS = cost of goods sold):
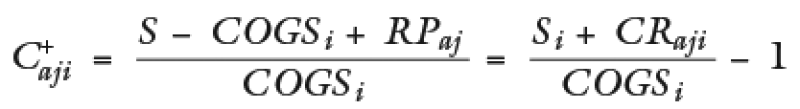
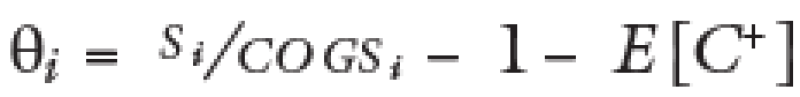
C+ formula after the adjustment (CRaji = country risk adjustment for the comparable i):
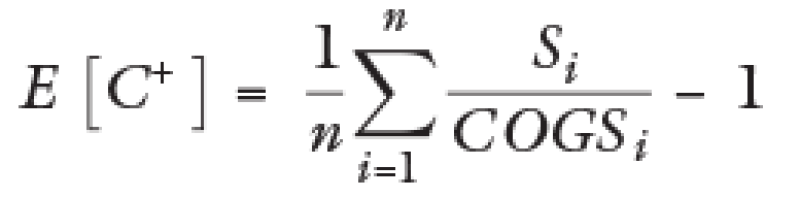
C+ formula for the mean before the adjustment:
Formula of the C+ mean after the adjustment:
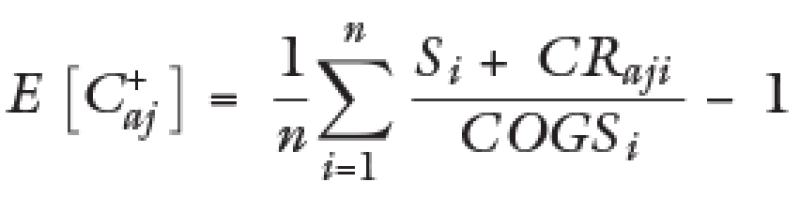
Whereby in this case CRaji > 0 for all i.
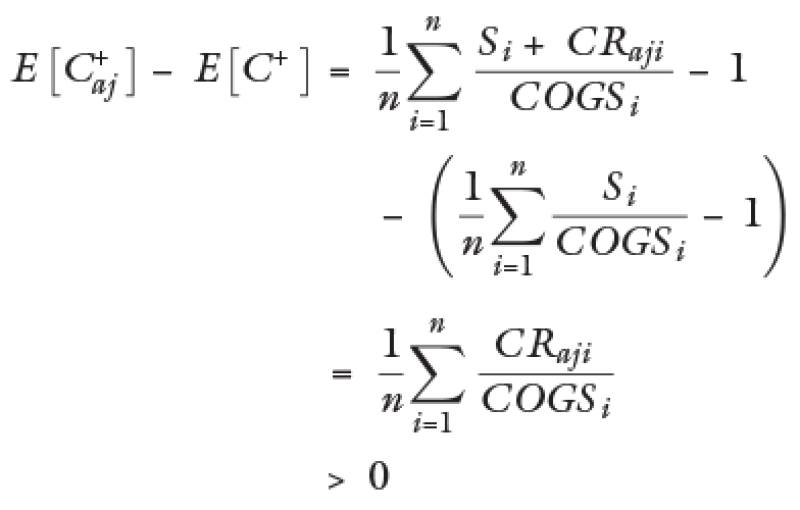
That is, it complies with the principle to increase the mean C+ to by carrying out the adjustment with the analysed formula. Now, we proceed to evaluate the effect on variance.
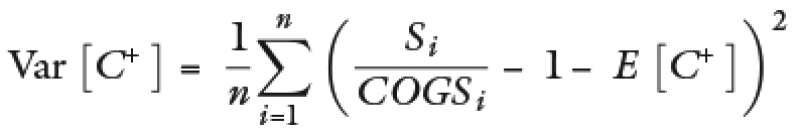
Formula of the C+ variance before the adjustment:
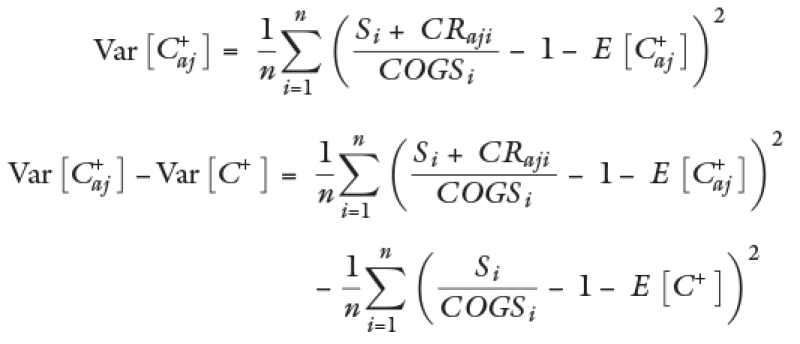
Formula of the variance after the adjustment:
Substituting

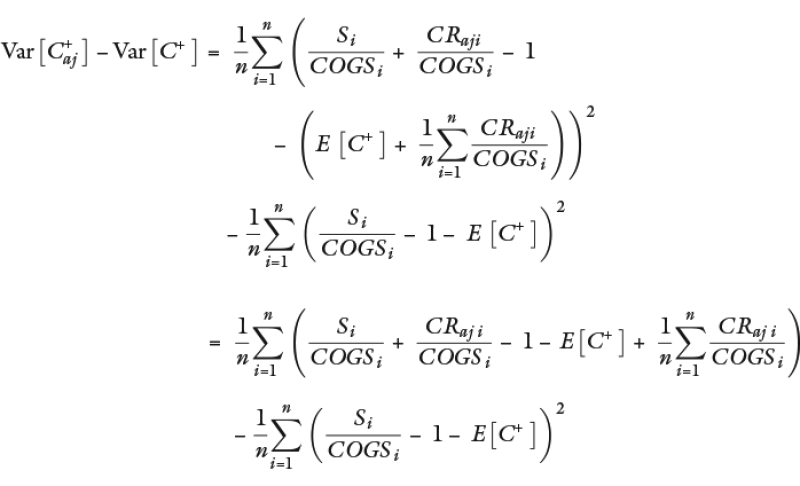
Substituting

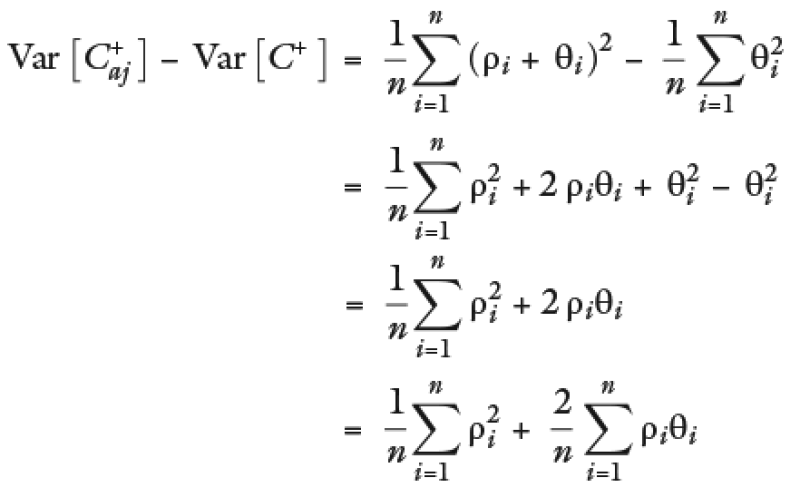
Substituting ρi and θi
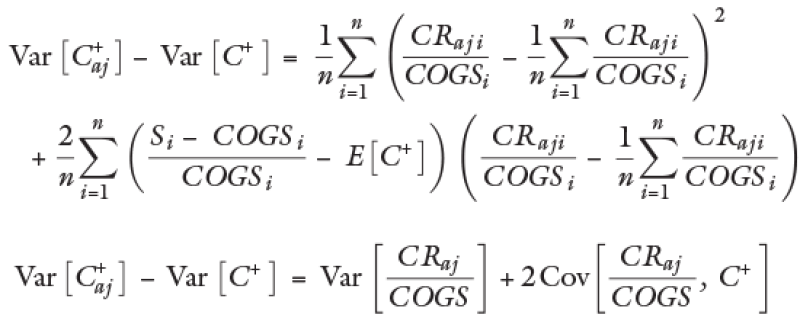
Such that it cannot be assured that all cases would meet that


That is, the effect on the variance when carrying out the adjustment is indeterminant to the mean, as we have seen in the previous example, the adjustment increases with certainty.
In conclusion, the proposed adjustment formula would increase the distribution mean (expected value of the margins) of the margins but would not necessarily increase the variance (volatility in the margins) that would be needed to be consistent with the risk-return hypothesis.
The risk-return hypothesis supposes a compensation for the uncertainty that should be obtained from effectively receiving the expected return. As a consequence, it is not entirely correct to carry out an adjustment from the perspective to 'add' an additional return as a function of a spread of financial assets that evaluate the country of the analysed company, and of the country of the comparable company country, as if there was certainty that this additional return will indeed be obtained. In fact, this difference is a sign that different risk levels exist among the expected return and the one that is ultimately obtained in each country.
It is of utmost importance that in the framework of the risk-return hypothesis, specifically transferred as the mean and variance measures for the distribution of profit margins, alternatives are applied that enforce the fundamentals of the said theoretical aspects in the distribution of the adjusted margins. This will ultimately have an effect in the change of the interquartile ranges once the country risk adjustment is made.
Conclusion
From the analysis and data collected, one may conclude that: i) there is no statistical evidence that demonstrates a positive correlation among location and returns; and ii) the mathematical formula employed for the adjustment does not align to the theoretical-economic assumptions on which its application is based.
Additionally, it should be considered that the application of this country risk adjustment would eliminate the location savings from operating in Mexico. That is, if a multinational group decides to install a subsidiary in the country due to its competitive advantages (for example, lower labour costs), the application of the adjustment tend to eliminate this competitive advantage by increasing the profitability of the Mexican taxpayer to the levels obtained by companies or transactions located in developed countries. In the times of the pandemic, this would be entirely counterproductive for the Mexican tax administration exactly at a time when the contraction of gross domestic product (GDP) requires the country to do precisely the opposite, increase foreign investment taking advantage of the desire for multinational groups to leave China, a direct competitor to Mexico in the manufacturing sector.
Certainly the issue of the lack of information to carry out a proper comparability analysis must not be neglected, however, it is preferable to insist on the use of internal comparables, the proper selection of comparable markets (even considering regional sets), or even the selection of the foreign counter party as entity under analysis, when the case allows. Furthermore, the taxpayer must understand the assumptions on which its analysis is based and the selection of comparables, as an improper selection could lead to very detrimental corrections from the tax authorities.
Click here to read this article in Spanish
Click here to read the entire 2020 Mexico Special Focus guide
Jesús Aldrin Rojas |
|
|---|---|

|
Managing partner QCG Transfer Pricing Practice T: +52 55 5395 1968 E: jesus.aldrin.rojas@qcglatam.com Jesús Aldrin Rojas is the managing partner of QCG Transfer Pricing Practice, located in Mexico City. He has more than 20 years of experience in transfer pricing, mostly involving the organisation of inter-company transactions, compliance support, controversy, and BEPS. Jesús supports domestic and international multinational groups providing strategic consulting in transfer pricing and international tax matters, mainly those effects arisen from the implementation of the OECD's BEPS plan. Jesús is the national coordinator of the Tax Committee of the Mexican-German Chamber of Commerce, the professor of transfer pricing in the master's of taxation programme at the Panamerican University, and a member of the transfer pricing technical committee at the Mexican Institute of Financial Executives. He is also the first certified transfer pricing expert before the Federal Judicial Council in Mexico. Jesús is an accountant, having graduated from Mexico's Universidad Nacional Autónoma de México (UNAM), and holds an MBA from the Instituto Tecnológico Autónomo de México (ITAM) and a master's degree in global management from Tulane University's Freeman School of Business. |
José Augusto Chamorro Gómez |
|
|---|---|

|
Senior economist QCG Transfer Pricing Practice T: +52 55 5395 1968 José Augusto Chamorro Gómez is a senior economist with QCG Transfer Pricing Practice. José assists domestic and foreign multinational groups by providing consulting, development of transfer pricing policy, as well as support in the drafting and compliance of transfer pricing documentation as per the terms required by Mexican legislation and Action 13 of the OECD's BEPS plan (country-by-country reporting and transfer pricing documentation). José specialises in providing support to companies in the IT sector, manufacturing and services in engagements involving the valuation of intangibles, development of econometric modeling, instrumentation of optimisation processes, etc. Jose is a member of the Mexican National College of Economists and a regular author in specialised tax publications in the country. José holds bachelor's and master's degrees in economics from the Instituto Politécnico Nacional (IPN) as well as a further master's degree in finance by the Instituto Tecnológico Autónomo de México (ITAM) in Mexico. |